Back to Courses


Data Analysis Courses - Page 100
Showing results 991-998 of 998

Using Descriptive Statistics to Analyze Data in R
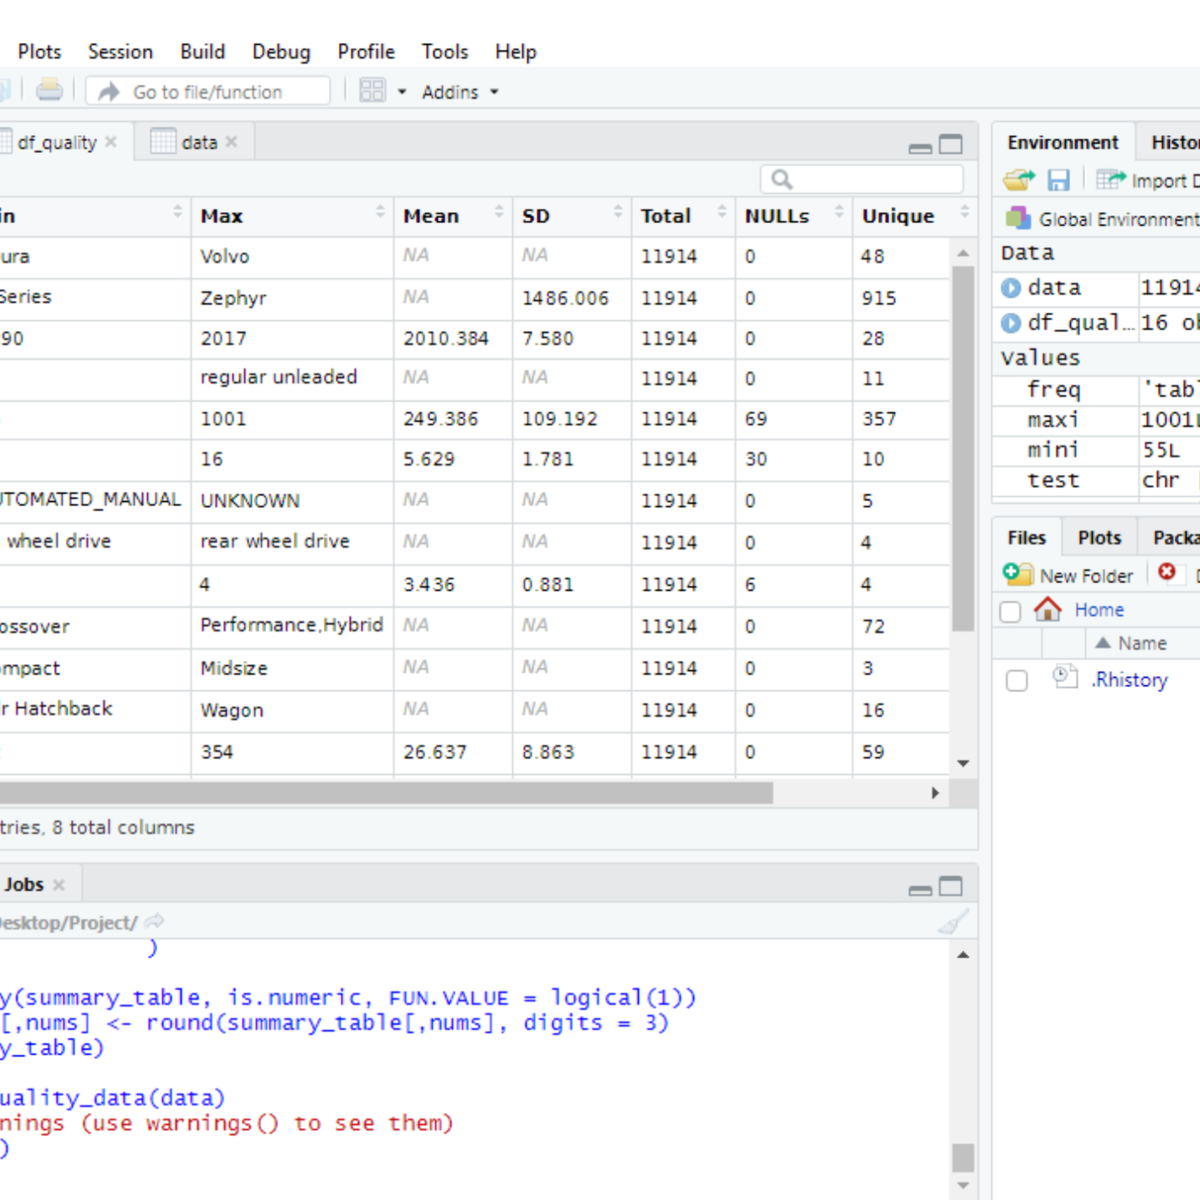
By the end of this project, you will create a data quality report file (exported to Excel in CSV format) from a dataset loaded in R, a free, open-source program that you can download. You will learn how to use the following descriptive statistical metrics in order to describe a dataset and how to calculate them in basic R with no additional libraries.
- minimum value
- maximum value
- average value
- standard deviation
- total number of values
- missing values
- unique values
- data types
You will then learn how to record the statistical metrics for each column of a dataset using a custom function created by you in R. The output of the function will be a ready-to-use data quality report. Finally, you will learn how to export this report to an external file.
A data quality report can be used to identify outliers, missing values, data types, anomalies, etc. that are present in your dataset. This is the first step to understand your dataset and let you plan what pre-processing steps are required to make your dataset ready for analysis.
Note: This course works best for learners who are based in the North America region. We’re currently working on providing the same experience in other regions.

Python and Machine Learning for Asset Management
This course will enable you mastering machine-learning approaches in the area of investment management. It has been designed by two thought leaders in their field, Lionel Martellini from EDHEC-Risk Institute and John Mulvey from Princeton University. Starting from the basics, they will help you build practical skills to understand data science so you can make the best portfolio decisions.
The course will start with an introduction to the fundamentals of machine learning, followed by an in-depth discussion of the application of these techniques to portfolio management decisions, including the design of more robust factor models, the construction of portfolios with improved diversification benefits, and the implementation of more efficient risk management models.
We have designed a 3-step learning process: first, we will introduce a meaningful investment problem and see how this problem can be addressed using statistical techniques. Then, we will see how this new insight from Machine learning can complete and improve the relevance of the analysis.
You will have the opportunity to capitalize on videos and recommended readings to level up your financial expertise, and to use the quizzes and Jupiter notebooks to ensure grasp of concept.
At the end of this course, you will master the various machine learning techniques in investment management.

Identifying the Right Role for Yourself
Data science and artificial intelligence are exciting, growing fields with a lot to offer prospective job seekers. However, even with the massive growth in technology and positions, there are still many barriers to entry. This course explores today’s challenges and opportunities within data science and artificial intelligence, the varying skills and education necessary for some commonly confused positions, as well as the specific job duties associated with various in-demand roles. By taking this course, learners will be able to discover which role and industry best fit their skills, interests, and background as well as identify any additional education needed, both of which will prepare them to apply and interview for DS/AI positions.
By the end of this course, students will be able to:
• Identify the required skills, education, and experience for various DS/AI roles.
• Recall the similarities and differences between various commonly confused DS/AI roles.
• Describe a data science/artificial intelligence role that aligns with personal goals and area of interest.
• Assess what additional skill training is needed to enter a specific DS/AI role.

Introduction to Big Data with Spark and Hadoop
Bernard Marr defines Big Data as the digital trace that we are generating in this digital era. In this course, you will learn about the characteristics of Big Data and its application in Big Data Analytics. You will gain an understanding about the features, benefits, limitations, and applications of some of the Big Data processing tools. You’ll explore how Hadoop and Hive help leverage the benefits of Big Data while overcoming some of the challenges it poses.
Hadoop is an open-source framework that allows for the distributed processing of large data sets across clusters of computers using simple programming models. Hive, a data warehouse software, provides an SQL-like interface to efficiently query and manipulate large data sets residing in various databases and file systems that integrate with Hadoop.
Apache Spark is an open-source processing engine that provides users new ways to store and make use of big data. It is an open-source processing engine built around speed, ease of use, and analytics. In this course, you will discover how to leverage Spark to deliver reliable insights. The course provides an overview of the platform, going into the different components that make up Apache Spark.
In this course, you will also learn about Resilient Distributed Datasets, or RDDs, that enable parallel processing across the nodes of a Spark cluster.

Cleaning and Exploring Big Data using PySpark
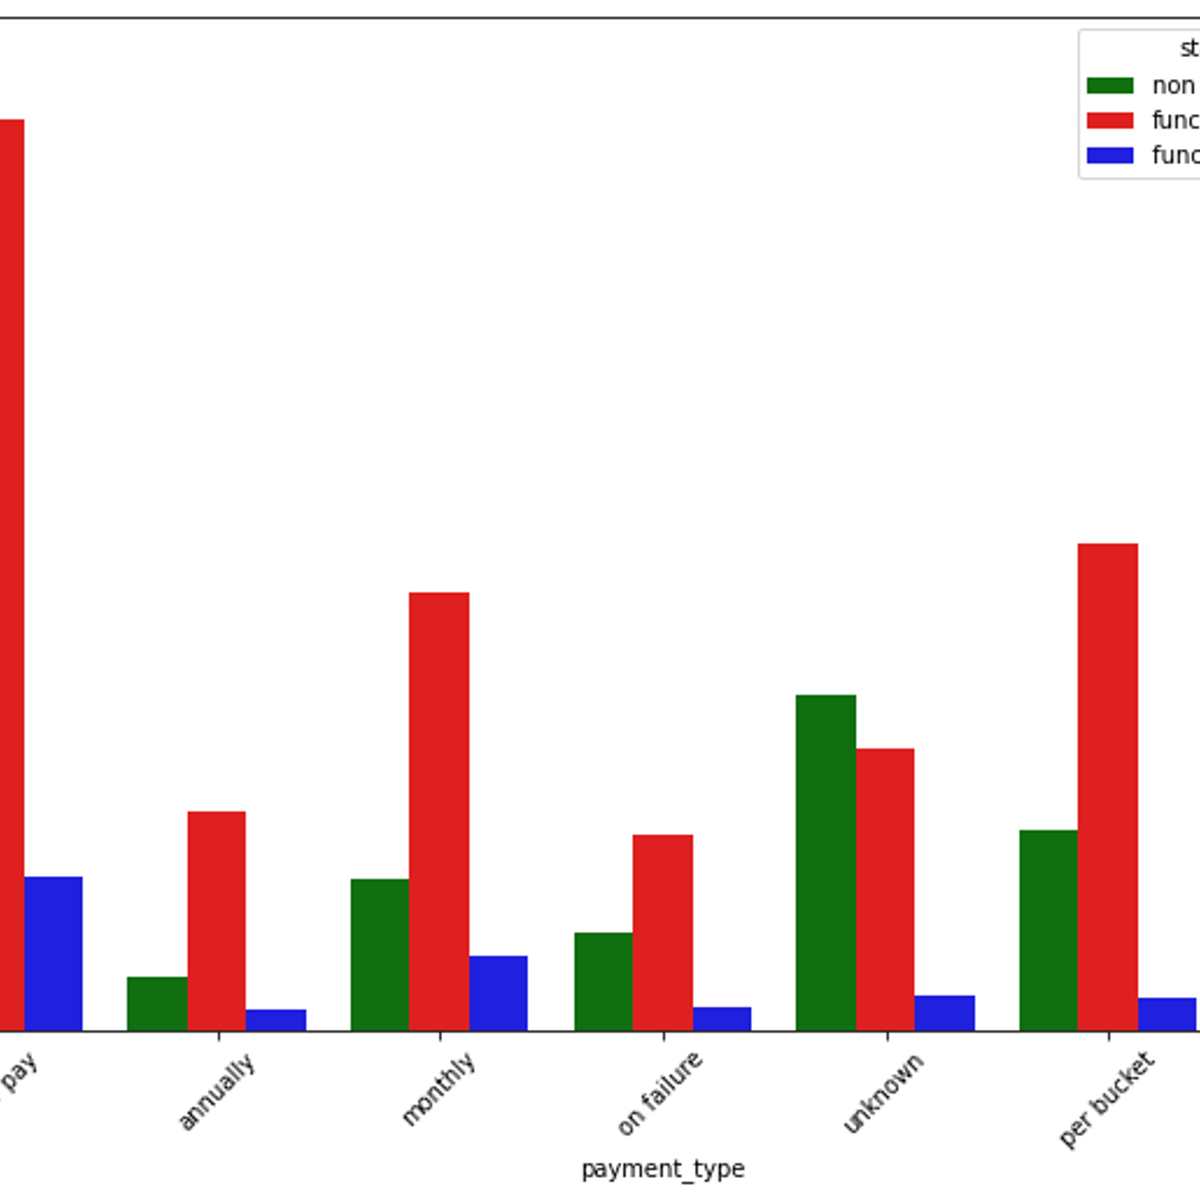
By the end of this project, you will learn how to clean, explore and visualize big data using PySpark. You will be using an open source dataset containing information on all the water wells in Tanzania. I will teach you various ways to clean and explore your big data in PySpark such as changing column’s data type, renaming categories with low frequency in character columns and imputing missing values in numerical columns. I will also teach you ways to visualize your data by intelligently converting Spark dataframe to Pandas dataframe.
Cleaning and exploring big data in PySpark is quite different from Python due to the distributed nature of Spark dataframes. This guided project will dive deep into various ways to clean and explore your data loaded in PySpark. Data preprocessing in big data analysis is a crucial step and one should learn about it before building any big data machine learning model.
Note: You should have a Gmail account which you will use to sign into Google Colab.
Note: This course works best for learners who are based in the North America region. We’re currently working on providing the same experience in other regions.

Access Bioinformatics Databases with Biopython
In this 1-hour long project-based course, you will learn how to access, parse, and visualize data from various bioinformatics sequence and structural online databases such as ENTREZ, PDB, KEGG and NCBI using Biopython.
You will also interact with various bioinformatics file formats such as FASTA, PDB, GENBANK and XML along with various parsers to read and modify these files using Biopython.
Note: This course works best for learners who are based in the North America region. We’re currently working on providing the same experience in other regions.

Deploying a Python Data Analytics web app on Heroku
Welcome to the “Deploying a Python data analytics web app on Heroku” guided project.
This project is for anyone interested in breaking or transitioning into the data science field and hopes to build a portfolio that stands out with unique projects. In this project we’re going to be building and deploying a python data analytics web application leveraging the General Social Survey data, which collects information and records of behaviours, experiences and opinions of residents of the Us and is funded by the National Science Foundation, particularly finding the correlation between education, income and happiness for US residents in 2016.
At the end of this project, learners will be able to deploy a python data analytics website using Python, Streamlit, Git and Heroku that they can show to potential hiring managers and recruiters as part of their portfolio.

Problem Solving with Excel
This course explores Excel as a tool for solving business problems. In this course you will learn the basic functions of excel through guided demonstration. Each week you will build on your excel skills and be provided an opportunity to practice what you’ve learned. Finally, you will have a chance to put your knowledge to work in a final project. Please note, the content in this course was developed using a Windows version of Excel 2013.
This course was created by PricewaterhouseCoopers LLP with an address at 300 Madison Avenue, New York, New York, 10017.
Popular Internships and Jobs by Categories
Browse
© 2024 BoostGrad | All rights reserved


