Back to Courses


Data Analysis Courses - Page 99
Showing results 981-990 of 998

Activity Recognition using Python, Tensorflow and Keras
Note: The rhyme platform currently does not support webcams, so this is not a live project.
This guided project is about human activity recognition using Python,TensorFlow2 and Keras. Human activity recognition comes under the computer vision domain. In this project you will learn how to customize the InceptionNet model using Tensorflow2 and Keras.
While you are watching me code, you will get a cloud desktop with all the required software pre-installed. This will allow you to code along with me. After all, we learn best with active, hands-on learning.
Special Feature:
1.Manually label images.
2. Learn how to use data augmentation normalization.
3. Learn about transfer learning using training the pre-trained model InceptionNet V3 on the data.
Note: This project works best for learners who are based in the North America region. We’re currently working on providing the same experience in other regions.

Learning SAS: Reading Raw Data from Fixed Columns
By the end of this project, you will be able to input raw data into SAS by applying the Formatted Input as well as embed raw data directly into SAS via the DATALINES statement.

Interpretable machine learning applications: Part 5
You will be able to use the Aequitas Tool as a tool to measure and detect bias in the outcome of a machine learning prediction model. As a use case, we will be working with the dataset about recidivism, i.e., the likelihood for a former imprisoned person to commit another offence within the first two years, since release from prison. The guided project will be making use of the COMPAS dataset, which already includes predicted as well as actual outcomes. Given also that this technique is largely based on statistical descriptors for measuring bias and fairness, it is very independent from specific Machine Learning (ML) prediction models. In this sense, the project will boost your career not only as a Data Scientists or ML developer, but also as a policy and decision maker.

Get, Shape, Combine and Merge the datasets using Power BI
By the end of this project, you will be able to professionally format and manipulate different datasets using Power Bi. you will be able to identify the basics of power BI, use it to create a model, and import data from different types of data sources. Moreover, you will be able to manipulate your data, reduce the number of data, merge columns, replace values, change data types and apply statistical and standard functions. You will also be able to insert a new index column, append two or more queries with each other, and sort and clean your dataset. Finally, you will be able to apply union, except and intersect, combine data of two tables and add results in a new table.
Many companies use Power BI to connect, Transform and model the data and also create charts, graphs, reports, and dashboards, which are collections of visuals, and finally, share reports with others using the Power BI service.
This guided project is for people in the field of data and data analysis. people who want to learn Power BI. It provides you with the important steps to be a business intelligence specialist.
Note: This course works best for learners who are based in the North America region. We’re currently working on providing the same experience in other regions.

Classification Trees in Python, From Start To Finish
In this 1-hour long project-based course, you will learn how to build Classification Trees in Python, using a real world dataset that has missing data and categorical data that must be transformed with One-Hot Encoding. We then use Cost Complexity Pruning and Cross Validation to build a tree that is not overfit to the Training Dataset.
This course runs on Coursera's hands-on project platform called Rhyme. On Rhyme, you do projects in a hands-on manner in your browser. You will get instant access to pre-configured cloud desktops containing all of the software and data you need for the project. Everything is already set up directly in your Internet browser so you can just focus on learning. For this project, you’ll get instant access to a cloud desktop with (e.g. Python, Jupyter, and Tensorflow) pre-installed.
Prerequisites:
In order to be successful in this project, you should be familiar with Python and the theory behind Decision Trees, Cost Complexity Pruning, Cross Validation and Confusion Matrices.
Notes:
- This course works best for learners who are based in the North America region. We’re currently working on providing the same experience in other regions.

Social Science Approaches to the Study of Chinese Society Part 2
This course is intended as a first step for learners who seek to become producers of social science research. It is organized as an introduction to the design and execution of a research study. It introduces the key elements of a proposal for a research study, and explains the role of each. It reviews the major types of qualitative and quantitative data used in social science research, and then introduces some of the most important sources of existing data available freely or by application, worldwide and for China. The course offers an overview of basic principles in the design of surveys, including a brief introduction to sampling. Basic techniques for quantitative analysis are also introduced, along with a review of common challenges that arise in the interpretation of results. Professional and ethical issues that often arise in the conduct of research are also discussed. The course concludes with an introduction to the options for further study available to the interested student, and an overview of the key steps involved in selecting postgraduate programs and applying for admission. Learners who complete the course will be able to make an informed decision about whether to pursue advanced studies, and should be adequately prepared to write an application for postgraduate study that exhibits basic understanding of key aspects of social science research paradigms and methodologies.
Explore the big questions in social science and learn how you can be a producer of social science research.
Course Overview video: https://youtu.be/QuMOAlwhpvU
Part 1 should be completed before taking this course: https://www.coursera.org/learn/social-science-study-chinese-society

Introduction to Relational Database and SQL
In this guided project, you will get hands-on experience working with a relational database using MySQL Workbench from Oracle. The basic knowledge you learn will allow you to work with any other relational database.
At the end of this project, you will be able to create a billing report and a club member roster.

Building Statistical Models in R: Linear Regression
Welcome to this project-based course Building Statistical Models in R: Linear Regression. This is a hands-on project that introduces beginners to the world of statistical modeling. In this project, you will learn the basics of building statistical models in R. We will start this hands-on project by exploring the dataset and creating visualizations for the dataset.
By the end of this 2-hour long project, you will understand how to build and interpret the result of simple linear regression models in R. Also, you will learn how to perform model assessments and check for assumptions using diagnostic plots. By extension, you will learn how to build and interpret the result of a multiple linear regression model.
Note that you do not need to be a data scientist to be successful in this guided project; just a familiarity with basic statistics and R suffice for this project. If you are not familiar with R and want to learn the basics, start with my previous guided project titled “Getting Started with R”. So, taking this project will give the needed requisite to complete this project on Building Statistical Models in R: Linear Regression. However, if you are comfortable using R, please join me on this wonderful and exciting ride! Let’s get our hands dirty!

Analyze City Data Using R and Tableau
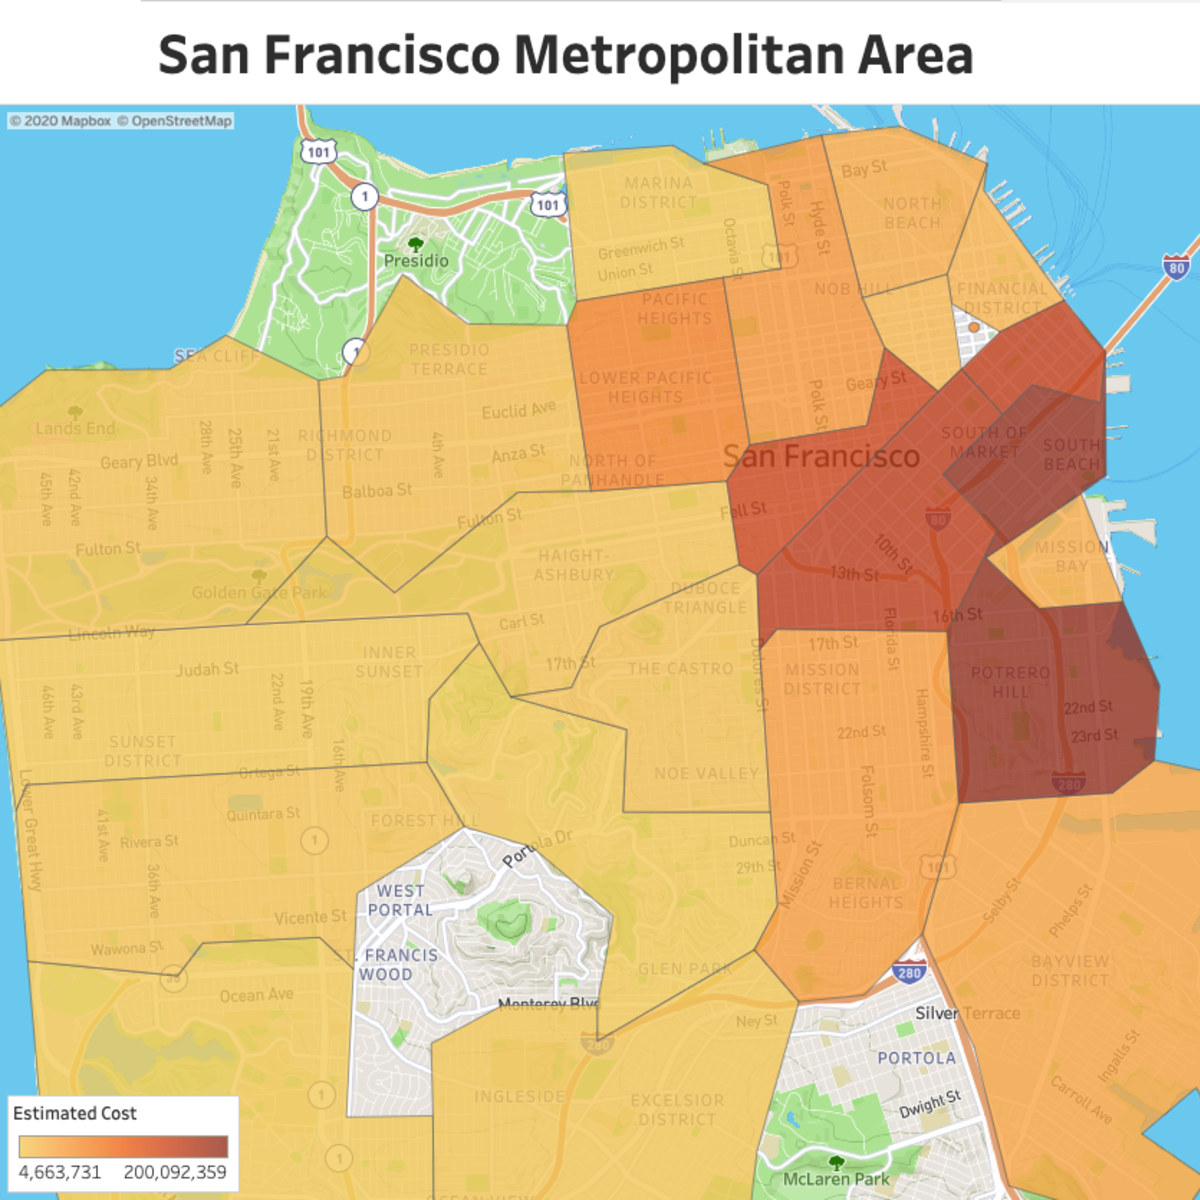
By the end of this project, you will create, clean, explore and analyze San Francisco’s building permit public data. We will use OpenStreetMap API to find the geo-coordinates of buildings using R and RStudio and we will analyze the final results in Tableau. You will learn basic data cleaning techniques using R, create a function to make requests to the OpenStreeMaps API and leverage Tableau to generate insights.
Note: This course works best for learners who are based in the North America region. We're currently working on providing the same experience in other regions.

Data Visualization with Plotly Express
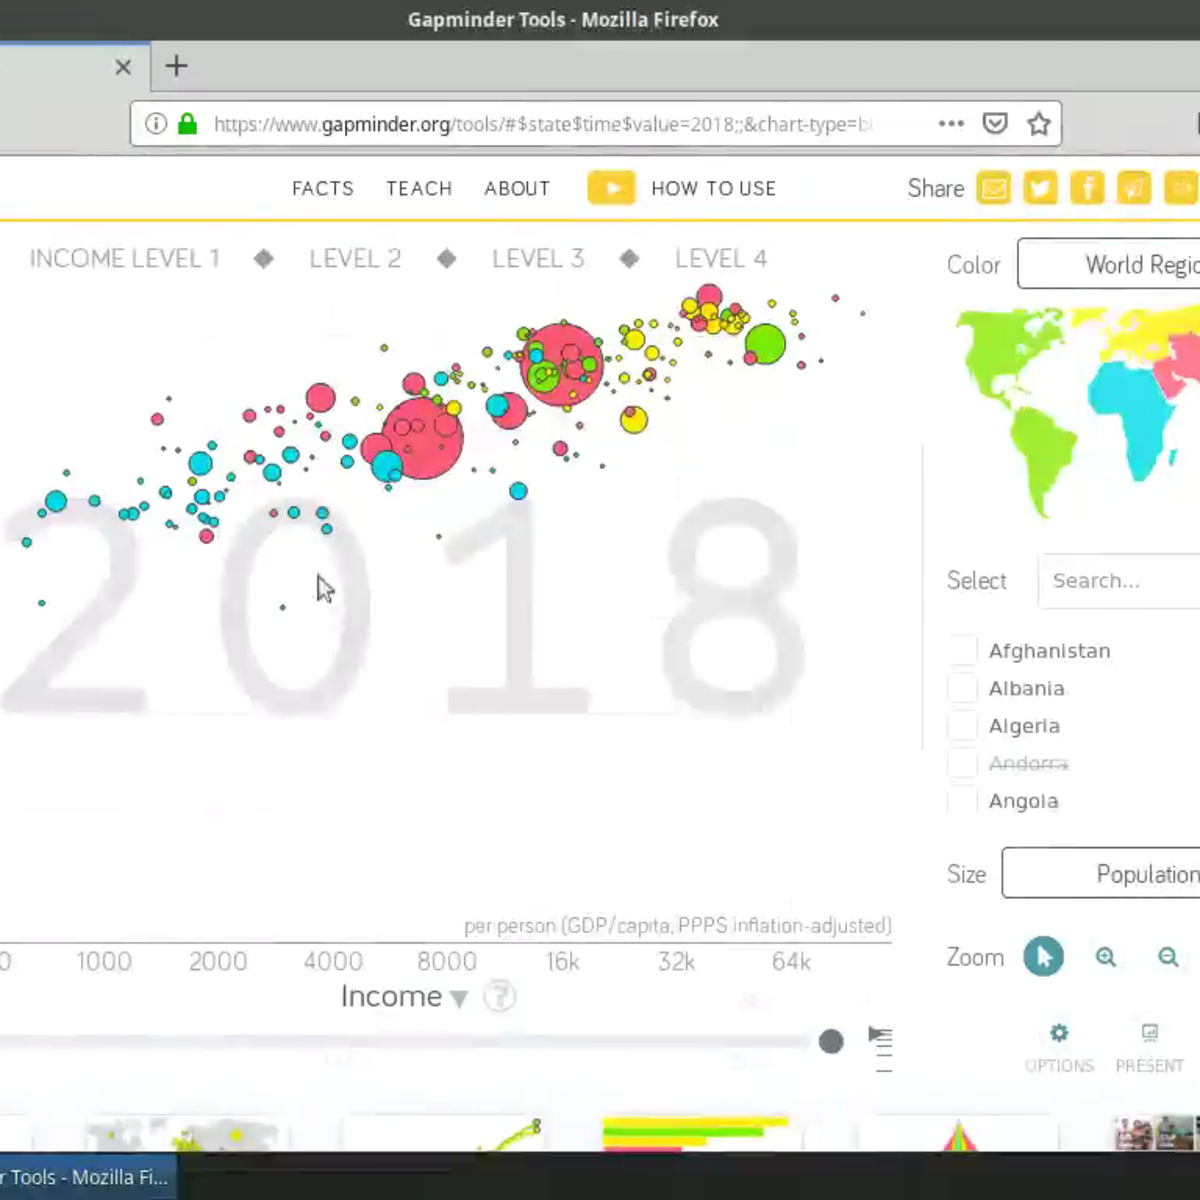
Welcome to this project-based course on Data Visualization with Plotly Express. In this project, you will create quick and interactive data visualizations with Plotly Express: a high-level data visualization library in Python inspired by Seaborn and ggplot2. You will explore the various features of the in-built Gapminder dataset, and produce interactive, publication-quality graphs to augment analysis.
This course runs on Coursera's hands-on project platform called Rhyme. On Rhyme, you do projects in a hands-on manner in your browser. You will get instant access to pre-configured cloud desktops containing all of the software and data you need for the project. Everything is already set up directly in your internet browser so you can just focus on learning. For this project, you’ll get instant access to a cloud desktop with Python, Jupyter, and Plotly Express pre-installed.
Notes:
- You will be able to access the cloud desktop 5 times. However, you will be able to access instructions videos as many times as you want.
- This course works best for learners who are based in the North America region. We’re currently working on providing the same experience in other regions.
Popular Internships and Jobs by Categories
Browse
© 2024 BoostGrad | All rights reserved


