Back to Courses


Data Analysis Courses - Page 10
Showing results 91-100 of 998
Geodesign: Change Your World
Ignite your career with Geodesign! The magnitude of challenges before us exceeds the reach of conventional approaches to planning and design. The pandemic has spawned urgent needs for new design approaches and solutions. Also at the doorstep is climate change: altering community design approaches; addressing infrastructure types and locations; as well as the need to protect carbon-sequestering environs. Geodesign provides a revolutionary way forward. It leverages information systems to foster collaborations that result in geographically specific, adaptive, and resilient strategies to wicked problems across scales of the natural and built environment. Geodesign builds confidence through dynamic real-time feedback, which empowers engaged collaborations for meaningful plans. With Geodesign, you can change your world – for the better!
This course includes well-illustrated lectures by the instructor, as well as guest lectures each week to ensure you are hearing a variety of viewpoints. Each week you will also be able to examine what Geodesign is through interactive mapping that showcases real-word Case Study examples of Geodesign from around the globe. As you move along in the course, you will discover the interrelationships of both the physical and human aspects that contribute to how Geodesign strategies are composed. The course concludes with you outlining your own Geodesign Challenge, and receiving feedback about that from your peers
Business Analytics Executive Overview
Businesses run on data, and data offers little value without analytics. The ability to process data to make predictions about the behavior of individuals or markets, to diagnose systems or situations, or to prescribe actions for people or processes drives business today. Increasingly many businesses are striving to become “data-driven”, proactively relying more on cold hard information and sophisticated algorithms than upon the gut instinct or slow reactions of humans.
This course will focus on understanding key analytics concepts and the breadth of analytic possibilities. Together, the class will explore dozens of real-world analytics problems and solutions across most major industries and business functions. The course will also touch on analytic technologies, architectures, and roles from business intelligence to data science, and from data warehouses to data lakes. And the course will wrap up with a discussion of analytics trends and futures.
Inferential Statistical Analysis with Python
In this course, we will explore basic principles behind using data for estimation and for assessing theories. We will analyze both categorical data and quantitative data, starting with one population techniques and expanding to handle comparisons of two populations. We will learn how to construct confidence intervals. We will also use sample data to assess whether or not a theory about the value of a parameter is consistent with the data. A major focus will be on interpreting inferential results appropriately.
At the end of each week, learners will apply what they’ve learned using Python within the course environment. During these lab-based sessions, learners will work through tutorials focusing on specific case studies to help solidify the week’s statistical concepts, which will include further deep dives into Python libraries including Statsmodels, Pandas, and Seaborn. This course utilizes the Jupyter Notebook environment within Coursera.
Data Management and Visualization
Whether being used to customize advertising to millions of website visitors or streamline inventory ordering at a small restaurant, data is becoming more integral to success. Too often, we’re not sure how use data to find answers to the questions that will make us more successful in what we do. In this course, you will discover what data is and think about what questions you have that can be answered by the data – even if you’ve never thought about data before. Based on existing data, you will learn to develop a research question, describe the variables and their relationships, calculate basic statistics, and present your results clearly. By the end of the course, you will be able to use powerful data analysis tools – either SAS or Python – to manage and visualize your data, including how to deal with missing data, variable groups, and graphs. Throughout the course, you will share your progress with others to gain valuable feedback, while also learning how your peers use data to answer their own questions.
Wrangling Data in the Tidyverse
Data never arrive in the condition that you need them in order to do effective data analysis. Data need to be re-shaped, re-arranged, and re-formatted, so that they can be visualized or be inputted into a machine learning algorithm. This course addresses the problem of wrangling your data so that you can bring them under control and analyze them effectively. The key goal in data wrangling is transforming non-tidy data into tidy data.
This course covers many of the critical details about handling tidy and non-tidy data in R such as converting from wide to long formats, manipulating tables with the dplyr package, understanding different R data types, processing text data with regular expressions, and conducting basic exploratory data analyses. Investing the time to learn these data wrangling techniques will make your analyses more efficient, more reproducible, and more understandable to your data science team.
In this specialization we assume familiarity with the R programming language. If you are not yet familiar with R, we suggest you first complete R Programming before returning to complete this course.
Network Analysis in Systems Biology
An introduction to data integration and statistical methods used in contemporary Systems Biology, Bioinformatics and Systems Pharmacology research. The course covers methods to process raw data from genome-wide mRNA expression studies (microarrays and RNA-seq) including data normalization, differential expression, clustering, enrichment analysis and network construction. The course contains practical tutorials for using tools and setting up pipelines, but it also covers the mathematics behind the methods applied within the tools. The course is mostly appropriate for beginning graduate students and advanced undergraduates majoring in fields such as biology, math, physics, chemistry, computer science, biomedical and electrical engineering. The course should be useful for researchers who encounter large datasets in their own research. The course presents software tools developed by the Ma’ayan Laboratory (http://labs.icahn.mssm.edu/maayanlab/) from the Icahn School of Medicine at Mount Sinai, but also other freely available data analysis and visualization tools. The ultimate aim of the course is to enable participants to utilize the methods presented in this course for analyzing their own data for their own projects. For those participants that do not work in the field, the course introduces the current research challenges faced in the field of computational systems biology.
Database Design with SQL Server Management Studio (SSMS)
In this 1-hour 40-minutes long project-based course, you will learn how to design a database system by identifying the entities and their attributes as well as the relations between these entities. Furthermore, you will get to implement the database system that you have designed using Microsoft SQL Server through SQL Server Management Studio. This project will have you explore key concepts of database design and will have you get introduced to the building blocks of the world of databases.
Note: This project works best for learners who are based in the North America region. We’re currently working on providing the same experience in other regions.
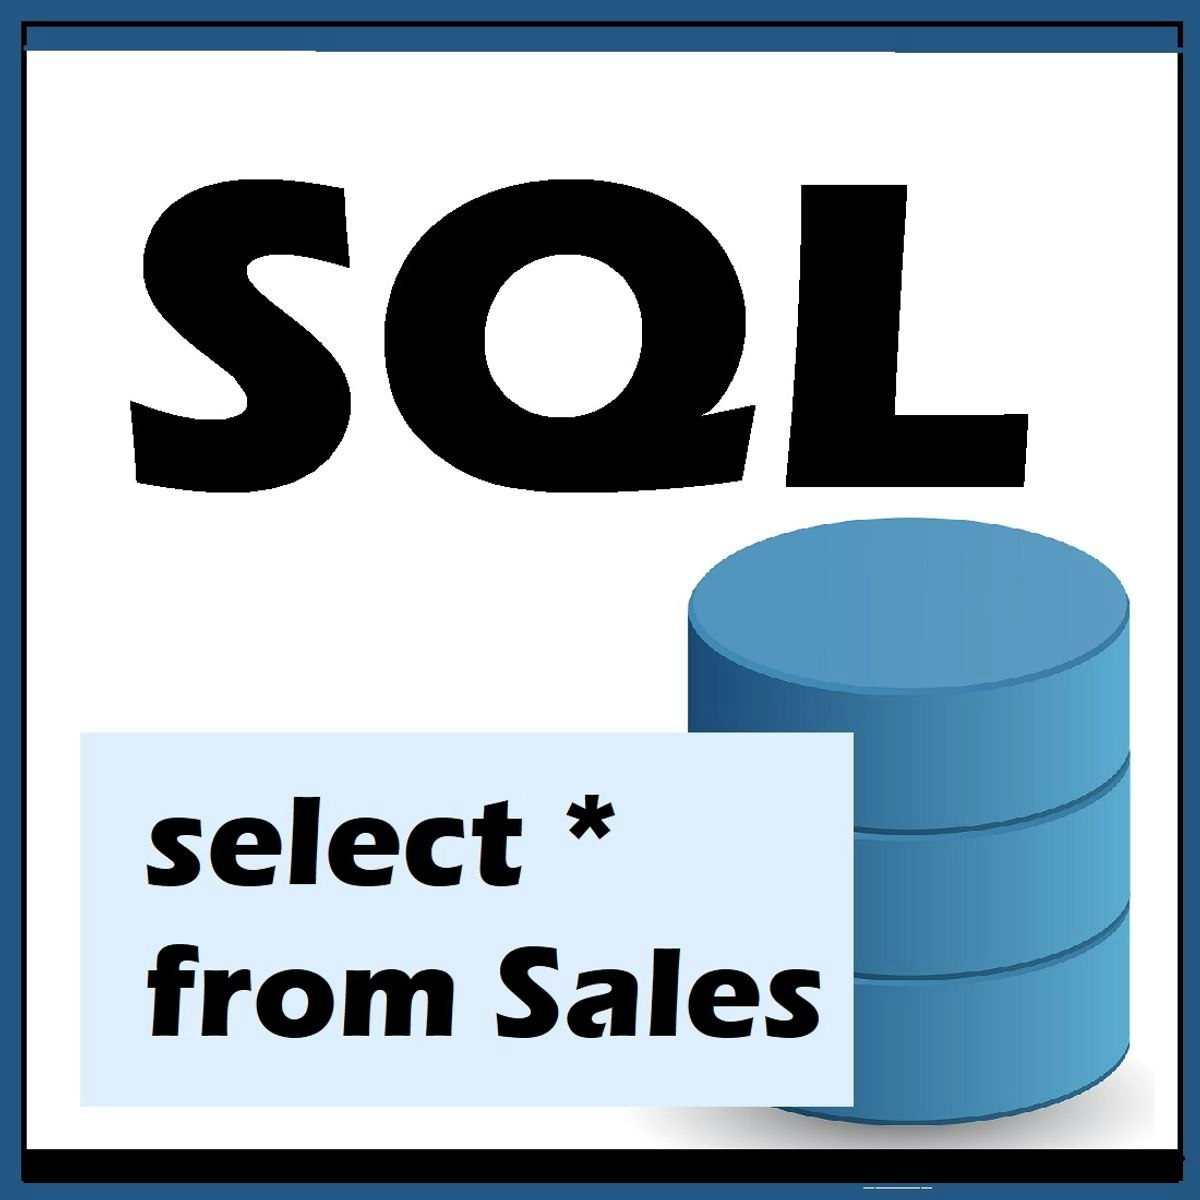
Retrieve Data using Single-Table SQL Queries
In this course you’ll learn how to effectively retrieve data from a relational database table using the SQL language.
We all know that most computer systems rely on at least one database to store data. Your tax information is stored in the database used by the Internal Revenue Service. Your phone stores your contacts’ names, addresses, email addresses, and phone numbers in a database. If you shop online, you’re viewing photos, descriptions, and prices of products that are stored in a database. Database designers go to great lengths to design databases so that the data can be stored securely and in an organized format. It’s important to note that the main reason they go to all that work is so that we can get the data back out again when we need it! That’s called “data retrieval”.
Data is retrieved or read from a relational database by using a language called SQL to query (or question) the database. SQL is referred to as “the language of relational databases”. It can be used by itself or embedded in programs to retrieve data. Once the data is retrieved, it can be displayed on a web page or PC application, or even printed on paper.
You’ll be practicing writing SQL queries using SQLiteStudio.
Next time you go online and look up the daily special at your favorite restaurant, you can think about the fact that it’s likely that an SQL query was used behind the scenes to fetch that data and pop it up on your screen. By the end of this course, you’ll even have a pretty good idea what the query might have looked like!
Note: This course works best for learners who are based in the North America region. We’re currently working on providing the same experience in other regions.
Understanding China, 1700-2000: A Data Analytic Approach, Part 2
The purpose of this course is to summarize new directions in Chinese history and social science produced by the creation and analysis of big historical datasets based on newly opened Chinese archival holdings, and to organize this knowledge in a framework that encourages learning about China in comparative perspective.
Our course demonstrates how a new scholarship of discovery is redefining what is singular about modern China and modern Chinese history. Current understandings of human history and social theory are based largely on Western experience or on non-Western experience seen through a Western lens. This course offers alternative perspectives derived from Chinese experience over the last three centuries. We present specific case studies of this new scholarship of discovery divided into two stand-alone parts, which means that students can take any part without prior or subsequent attendance of the other part.
Part 1 (https://www.coursera.org/learn/understanding-china-history-part-1) focuses on comparative inequality and opportunity and addresses two related questions ‘Who rises to the top?’ and ‘Who gets what?’.
Part 2 (this course) turns to an arguably even more important question ‘Who are we?’ as seen through the framework of comparative population behavior - mortality, marriage, and reproduction – and their interaction with economic conditions and human values. We do so because mortality and reproduction are fundamental and universal, because they differ historically just as radically between China and the West as patterns of inequality and opportunity, and because these differences demonstrate the mutability of human behavior and values.
Course Overview video: https://youtu.be/dzUPRyJ4ETk
Cloud Pricing and Financial Operations (FinOps)
This specialization is targeted to cloud sales, marketing managers, business executives, and operations and data center managers who need education around the specifics of the business aspects of operating a cloud at Cloud Service Providers (CSPs), Distributors, Resellers and Managed Service Providers who service cloud customers.
This course is part of the Intel® Cloud Business Professional Specialization. Completion of specialization offers a badge via Credly.
● Cloud FinOps Overview and TCO Models: This lesson discusses cloud cost modeling and the emergence of the FinOps function. Also covered will be cloud cost management best practices and key personas involved of cloud economics. (Duration: 15 minutes)
● Cloud Service Provider Accounting Structures: This lesson will overview how the 3 large Cloud Services manage their enterprise accounting efforts including enterprise agreements and accounting entitlements. (Duration: 10 minutes)
● Native Cloud Billing Management and Reporting: This lesson addresses the usage invoice delivery, native cost explorer and usage reporting for each of the three large Cloud Service providers. (Duration: 15 minutes)
● Cloud Pricing Models: This lesson covers cloud pricing models for each of the 3 large Cloud Service Providers. Also addressed will be reservations, spot instances and native pricing estimators. (Duration: 30 minutes)
● Controlling Cloud Costs: This 3-part course will dive into the ideas and intricacies around controlling spending in the cloud. Included in this course are specific demos for the 3 large Cloud Service Providers. (Duration: 80 minutes)
● Cloud Multi-Tenant Management and Billback: This course discusses the business aspects of multi-tenant cloud billings. It covers showback vs billback billing models and prepaid instances and commitments. (Duration: 10 minutes)
Popular Internships and Jobs by Categories
Find Jobs & Internships
Browse


© 2024 BoostGrad | All rights reserved