Back to Courses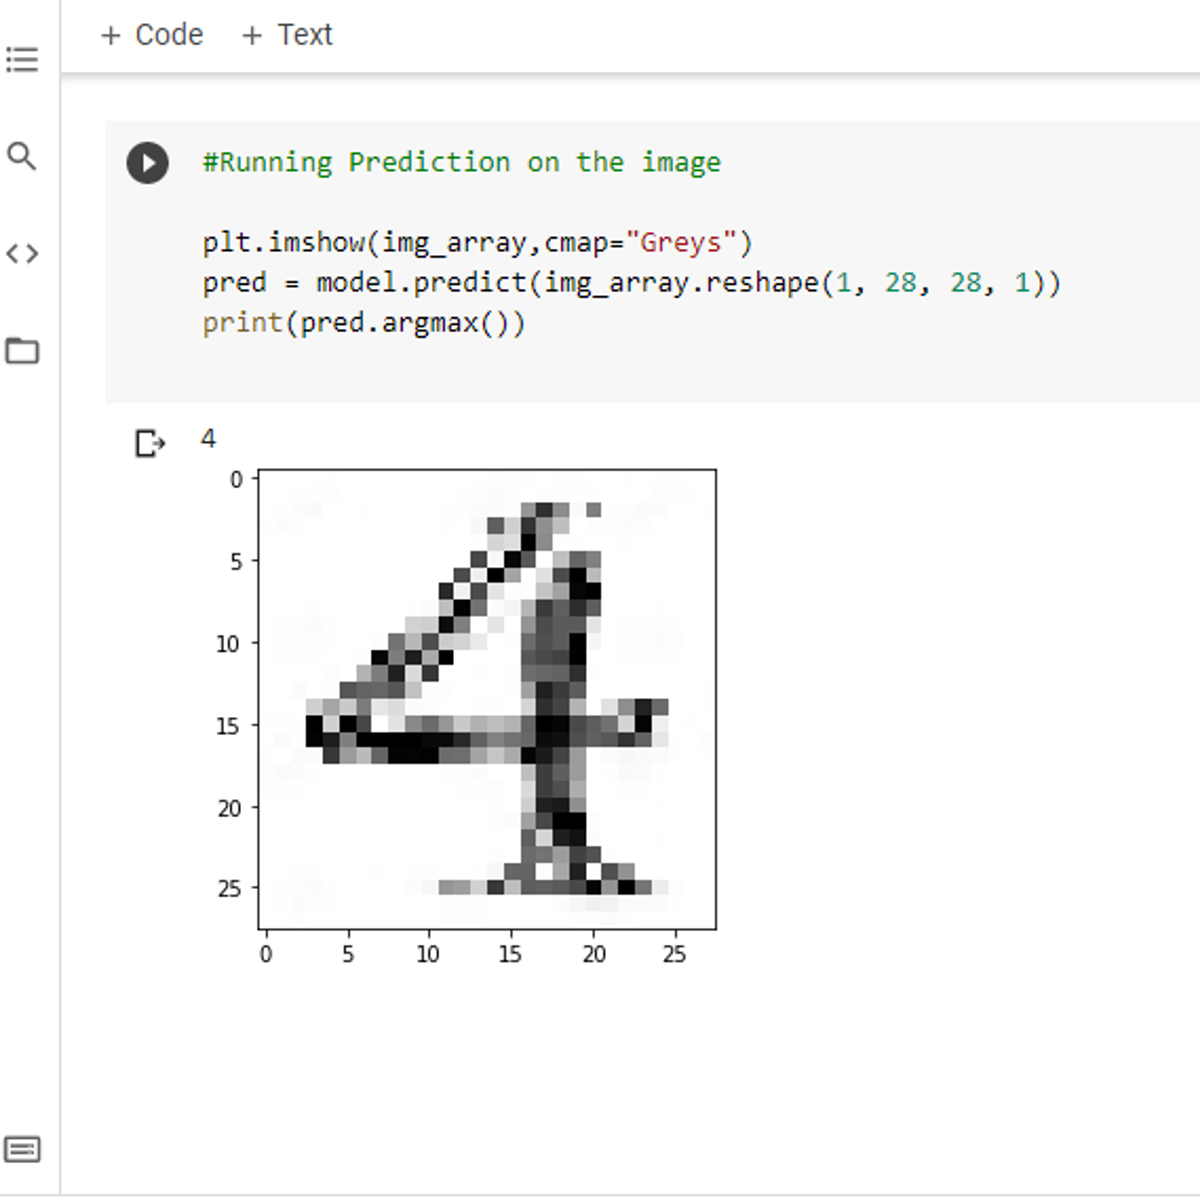






Data Analysis Courses - Page 11
Showing results 101-110 of 998

Build a Machine Learning Image Classifier with Python
In this 1-hour long project-based course, you will learn how to build your own Machine Learning Image Classifier using Python and Colab. You will be able to easily load the data, preview it, process and normalize it, then train and test your model! I hope you enjoy the experience!
Note: This course works best for learners who are based in the North America region. We’re currently working on providing the same experience in other regions.
Data Science Math Skills
Data science courses contain math—no avoiding that! This course is designed to teach learners the basic math you will need in order to be successful in almost any data science math course and was created for learners who have basic math skills but may not have taken algebra or pre-calculus. Data Science Math Skills introduces the core math that data science is built upon, with no extra complexity, introducing unfamiliar ideas and math symbols one-at-a-time.
Learners who complete this course will master the vocabulary, notation, concepts, and algebra rules that all data scientists must know before moving on to more advanced material.
Topics include:
~Set theory, including Venn diagrams
~Properties of the real number line
~Interval notation and algebra with inequalities
~Uses for summation and Sigma notation
~Math on the Cartesian (x,y) plane, slope and distance formulas
~Graphing and describing functions and their inverses on the x-y plane,
~The concept of instantaneous rate of change and tangent lines to a curve
~Exponents, logarithms, and the natural log function.
~Probability theory, including Bayes’ theorem.
While this course is intended as a general introduction to the math skills needed for data science, it can be considered a prerequisite for learners interested in the course, "Mastering Data Analysis in Excel," which is part of the Excel to MySQL Data Science Specialization. Learners who master Data Science Math Skills will be fully prepared for success with the more advanced math concepts introduced in "Mastering Data Analysis in Excel."
Good luck and we hope you enjoy the course!

Advanced Relational Database and SQL
In this 1-hour long project-based course, you will gain hands-on experience and learn about advanced SQL topics such as stored procedures, tiggers, functions, common table expressions and recursion. If you have intermediate level of experience with SQL and want to learn more, this course is for you!
Note: This is an advanced level course. Taking my course "Introduction to Relational Database and SQL" and "Intermediate Relational Database and SQL" before taking this course is highly recommended. Especially if you do not have any previous experience with relational database and SQL.

Build and Execute MySQL, PostgreSQL, and SQLServer to Data Catalog Connectors
This is a self-paced lab that takes place in the Google Cloud console. In this lab you will explore existing datasets with Data Catalog and mine the table and column metadata for insights.

Geographical Information Systems - Part 2
This course is the second part of a course dedicated to the theoretical and practical bases of Geographic Information Systems (GIS).
It offers an introduction to GIS that does not require prior computer skills. It gives the opportunity to quickly acquire the basics that allow you to create spatial databases and produce geographic maps.
This is a practical course that relies on the use of free Open Source software (QGIS, Geoda).
In the first part of the course (Geographical Information Systems - Part 1), you explored the basics of land digitization and geodata storage. In particular, you learned how to:
- Characterize spatial objects and phenomena (spatial modeling) from the point of view of their positioning in space (coordinate systems and projections, spatial relationships) and according to their intrinsic nature (object or vector mode vs. image or raster mode);
- Use various data acquisition methods (direct measurement, georeferencing of images, digitization, existing data source, etc.);
- Use various geodata storage methods (simple files and relational databases);
- Use data modeling tools to describe and implement a database;
- Create queries in a query language and data manipulation.
The second part of the course deals with spatial analysis methods and georeferenced information representation techniques. In particular, you will learn how to:
- Analyze the spatial properties of discrete variables, for example by quantifying spatial autocorrelation;
- Work with continuous variables (sampling, interpolation and construction of isolines)
- Use digital elevation models (DEMs) and their derivatives (slope, orientation, etc.);
- Use geodata superposition techniques;
- Produce cartographic documents according to the rules of the semiology of graphics;
- Explore other forms of spatial representation (interactive cartography on the internet, 3D representations, and augmented reality).
The page https://www.facebook.com/moocsig provides an interactive forum for participants in this course.

Extract Text Data with Java and Regex
By the end of this project, you will extract email text data from a file using a regular expression in a Java program.
Java is a widely used programming language largely because of its versatility. One of the Developer tools often needed is file data extraction and Java contains methods to handle that task. For example, email files containing email addresses can often be difficult to analyze because of extraneous data. Error log files may also be more easily analyzed by matching specific data fields.
Note: This course works best for learners who are based in the North America region. We’re currently working on providing the same experience in other regions.
Data Analysis and Reporting in SAS Visual Analytics
In this course, you learn how to use SAS Visual Analytics on SAS Viya to modify data for analysis, perform data discovery and analysis, and create interactive reports.

Apache Spark (TM) SQL for Data Analysts
Apache Spark is one of the most widely used technologies in big data analytics. In this course, you will learn how to leverage your existing SQL skills to start working with Spark immediately. You will also learn how to work with Delta Lake, a highly performant, open-source storage layer that brings reliability to data lakes. By the end of this course, you will be able to use Spark SQL and Delta Lake to ingest, transform, and query data to extract valuable insights that can be shared with your team.

Using Date and Time Functions in Excel
By the end of this project you will be able to use 15 practical date & time functions in Excel, and have a better understanding of their use. You’ll learn the basic use of the function, an example formula for the function, and some alternative ways to use the function by adding or combining to the formula. I will guide you step-by-step, explaining every part of the formula and how it achieves the desired calculation.

FIFA20 Data Exploration using Python
By the end of this project, you will learn to use data Exploration techniques in order to uncover some initial patterns, insights and interesting points in your dataset. We are going to use a dataset consisting 5 CSV files, consisting of the data related to players in FIFA video game. We will clean and prepare it by dropping useless columns, calculating new features for our dataset and filling up the null values properly. and then we will start our exploration and we'll do some visualizations.
Note: This project works best for learners who are based in the North America region. We’re currently working on providing the same experience in other regions.
Popular Internships and Jobs by Categories
Find Jobs & Internships
Browse
© 2024 BoostGrad | All rights reserved