Back to Courses


Data Science Courses - Page 82
Showing results 811-820 of 1407
Introduction to Embedded Machine Learning
Machine learning (ML) allows us to teach computers to make predictions and decisions based on data and learn from experiences. In recent years, incredible optimizations have been made to machine learning algorithms, software frameworks, and embedded hardware. Thanks to this, running deep neural networks and other complex machine learning algorithms is possible on low-power devices like microcontrollers.
This course will give you a broad overview of how machine learning works, how to train neural networks, and how to deploy those networks to microcontrollers, which is known as embedded machine learning or TinyML. You do not need any prior machine learning knowledge to take this course. Familiarity with Arduino and microcontrollers is advised to understand some topics as well as to tackle the projects. Some math (reading plots, arithmetic, algebra) is also required for quizzes and projects.
We will cover the concepts and vocabulary necessary to understand the fundamentals of machine learning as well as provide demonstrations and projects to give you hands-on experience.
Precalculus: Relations and Functions
This course helps to build the foundational material to use mathematics as a tool to model, understand, and interpret the world around us. This is done through studying functions, their properties, and applications to data analysis. Concepts of precalculus provide the set of tools for the beginning student to begin their scientific career, preparing them for future science and calculus courses. This course is designed for all students, not just those interested in further mathematics courses. Students interested in the natural sciences, computer sciences, psychology, sociology, or similar will genuinely benefit from this introductory course, applying the skills learned to their discipline to analyze and interpret their subject material. Students will be presented with not only new ideas, but also new applications of an old subject. Real-life data, exercise sets, and regular assessments help to motivate and reinforce the content in this course, leading to learning and mastery.
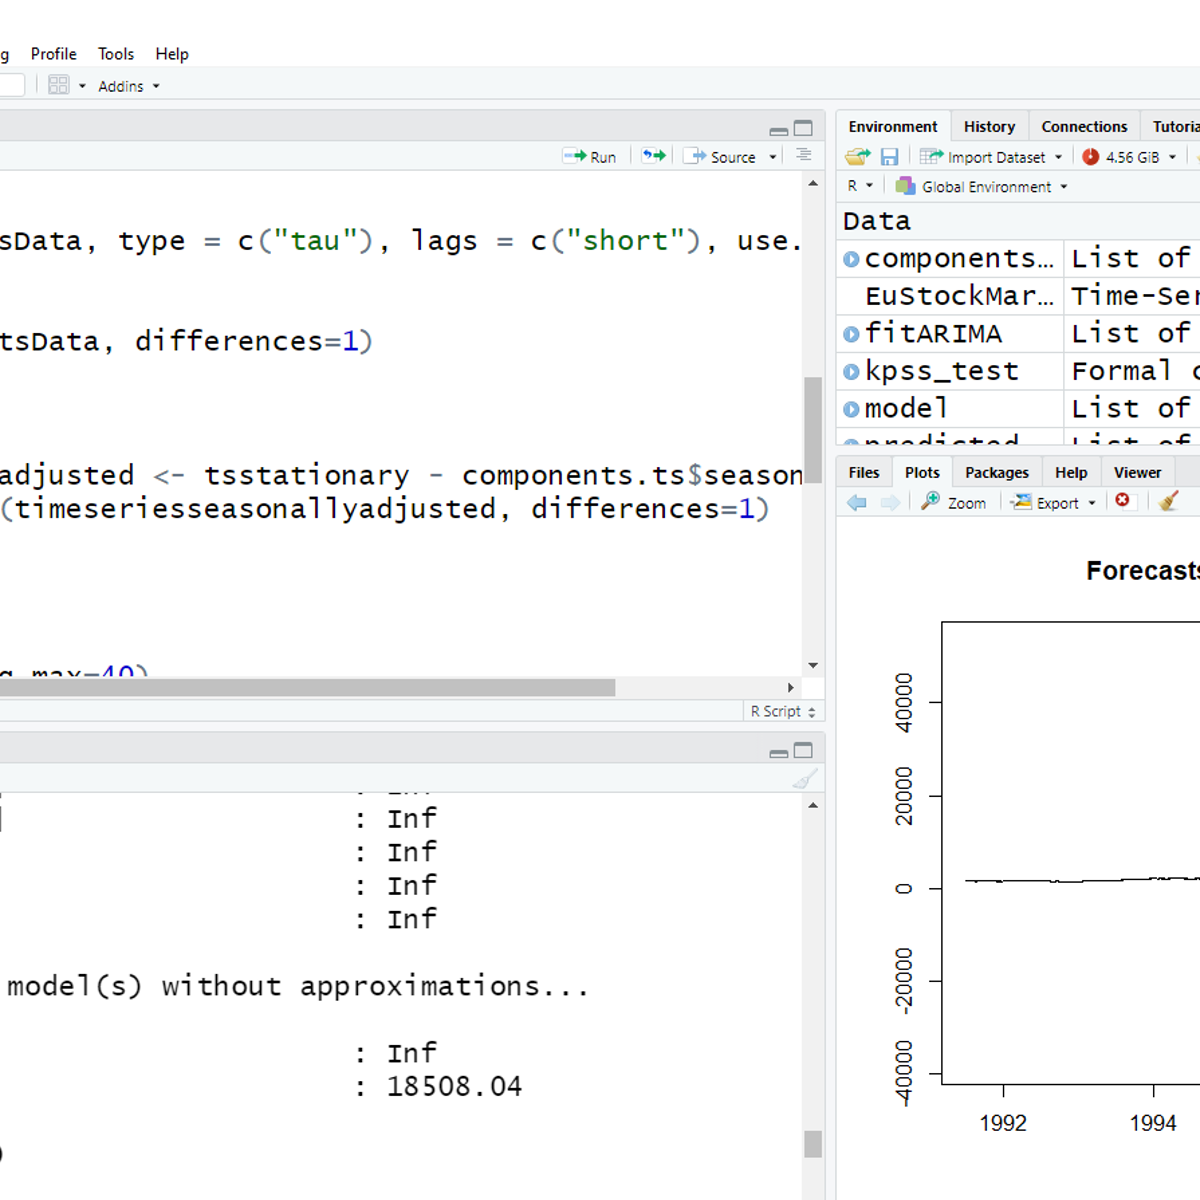
Time Series Analysis (ARIMA) with R
In this project, you will learn to conduct a thorough analysis of a time series data using ARIMA. The project explains the basic concepts of time series analysis and illustrates the same with hands-on activity on R Studio. It describes the types of time series data and its distinct components. The project covers how to conduct diagnostic tests to check for core assumptions of ARIMA, evaluating model process and orders from ACF, PACF graphs. Finally, it derives best fit model to forecast future values.
Automated Reasoning: satisfiability
In this course you will learn how to apply satisfiability (SAT/SMT) tools to solve a wide range of problems.
Several basic examples are given to get the flavor of the applications: fitting rectangles to be applied for printing posters, scheduling problems, solving puzzles, and program correctness. Also underlying theory is presented: resolution as a basic approach for propositional satisfiability, the CDCL framework to scale up for big formulas, and the simplex method to deal with linear inequallities.
The light weight approach to following this course is just watching the lectures and do the corresponding quizzes. To get a flavor of the topic this may work out fine. However, the much more interesting approach is to use this as a basis to apply SAT/SMT yourself on several problems, for instance on the problems presented in the honor's assignment.
Excel Skills for Business: Intermediate I
Spreadsheet software remains one of the most ubiquitous pieces of software used in workplaces across the world. Learning to confidently operate this software means adding a highly valuable asset to your employability portfolio. In the United States alone, millions of job advertisements requiring Excel skills are posted every day. Research by Burning Glass Technologies and Capital One shows that digitals skills lead to higher income and better employment opportunities at a time when digital skills job are growing much faster than non-digital jobs.
In this second course of our Excel specialization Excel Skills for Business you will build on the strong foundations of the Essentials course. Intermediate Skills I will expand your Excel knowledge to new horizons. You are going to discover a whole range of skills and techniques that will become a standard component of your everyday use of Excel. In this course, you will build a solid layer of more advanced skills so you can manage large datasets and create meaningful reports. These key techniques and tools will allow you to add a sophisticated layer of automation and efficiency to your everyday tasks in Excel.
Once again, we have brought together a great teaching team that will be with you every step of the way. Prashan and Nicky will guide you through each week (and I am even going to make a guest appearance in Week 5 to help you learn about my favourite tool in Excel - shh, no spoilers!). Work through each new challenge step-by-step and in no time you will surprise yourself by how far you have come. This time around, we are going to follow Uma's trials and tribulations as she is trying to find her feet in a new position in the fictitious company PushPin. For those of you who have done the Essentials course, you will already be familiar with the company. Working through her challenges which are all too common ones that we encounter everyday, will help you to more easily relate to the skills and techniques learned in each week and apply them to familiar and new contexts.
R Programming
In this course you will learn how to program in R and how to use R for effective data analysis. You will learn how to install and configure software necessary for a statistical programming environment and describe generic programming language concepts as they are implemented in a high-level statistical language. The course covers practical issues in statistical computing which includes programming in R, reading data into R, accessing R packages, writing R functions, debugging, profiling R code, and organizing and commenting R code. Topics in statistical data analysis will provide working examples.
Introduction to Data Analytics
This course presents a gentle introduction into the concepts of data analysis, the role of a Data Analyst, and the tools that are used to perform daily functions. You will gain an understanding of the data ecosystem and the fundamentals of data analysis, such as data gathering or data mining. You will then learn the soft skills that are required to effectively communicate your data to stakeholders, and how mastering these skills can give you the option to become a data driven decision maker.
This course will help you to differentiate between the roles of a Data Analyst, Data Scientist, and Data Engineer. You will learn the responsibilities of a Data Analyst and exactly what data analysis entails. You will be able to summarize the data ecosystem, such as databases and data warehouses. You will then uncover the major vendors within the data ecosystem and explore the various tools on-premise and in the cloud. Continue this exciting journey and discover Big Data platforms such as Hadoop, Hive, and Spark. By the end of this course you will be able to visualize the daily life of a Data Analyst, understand the different career paths that are available for data analytics, and identify the many resources available for mastering this profession.
Throughout this course you will learn the key aspects to data analysis. You will begin to explore the fundamentals of gathering data, and learning how to identify your data sources. You will then learn how to clean, analyze, and share your data with the use of visualizations and dashboard tools. This all comes together in the final project where it will test your knowledge of the course material, explore what it means to be a Data Analyst, and provide a real-world scenario of data analysis.
This course does not require any prior data analysis, spreadsheet, or computer science experience. All you need to get started is basic computer literacy, high school level math, and access to a modern web browser such as Chrome or Firefox.
Introduction to Data Analytics
This course equips you with a practical understanding and a framework to guide the execution of basic analytics tasks such as pulling, cleaning, manipulating and analyzing data by introducing you to the OSEMN cycle for analytics projects. You’ll learn to perform data analytics tasks using spreadsheet and SQL queries. You will also be introduced to using the Python programming language to manipulate datasets as an alternative to spreadsheets. You will learn foundational programming concepts and how they apply to marketing. You will also learn how to use Tableau to create data visualizations and dashboards.
By the end of this course, you will be able to:
• State business goals, KPIs and associated metrics
• Apply a Data Analysis Process: OSEMN
• Identify and define the relevant data to be collected for marketing
• Compare and contrast the different formats and use cases of different kinds of data
• Identify gaps in data collected and describe the strengths and weaknesses
• Demonstrate proficiency in Python with variables, control flow, loops, and basic data structures
• Sort, query and structure data in spreadsheets and with Python libraries
• Write basic SQL statements to select, group and filter data
• Visualize data patterns and trends with spreadsheets
• Utilize Tableau to visualize data patterns and trends
This course is designed for people who want to learn the basics of data analytics including using spreadsheets and Python to sort and structure data and using Tableau to visualize data patterns.
Learners don't need marketing or data analysis experience, but should have basic internet navigation skills and be eager to participate. Learners also need access to a computer with strong internet connection. Ideally learners have already completed course 1 (Marketing Analytics Foundation) in this program.
Population Health: Responsible Data Analysis
In most areas of health, data is being used to make important decisions. As a health population manager, you will have the opportunity to use data to answer interesting questions. In this course, we will discuss data analysis from a responsible perspective, which will help you to extract useful information from data and enlarge your knowledge about specific aspects of interest of the population.
First, you will learn how to obtain, safely gather, clean and explore data. Then, we will discuss that because data are usually obtained from a sample of a limited number of individuals, statistical methods are needed to make claims about the whole population of interest. You will discover how statistical inference, hypothesis testing and regression techniques will help you to make the connection between samples and populations.
A final important aspect is interpreting and reporting. How can we transform information into knowledge? How can we separate trustworthy information from noise? In the last part of the course, we will cover the critical assessment of the results, and we will discuss challenges and dangers of data analysis in the era of big data and massive amounts of information.
In this course, we will emphasize the concepts and we will also teach you how to effectively perform your analysis using R. You do not need to install R on your computer to follow the course, you will be able to access R and all the example data sets within the Coursera environment.
This course will become part of the to-be-developed Leiden University master program Population Health Management. If you wish to find out more about this program see the last reading of this Course!
Data Visualization
Learn the general concepts of data mining along with basic methodologies and applications. Then dive into one subfield in data mining: pattern discovery. Learn in-depth concepts, methods, and applications of pattern discovery in data mining. We will also introduce methods for pattern-based classification and some interesting applications of pattern discovery. This course provides you the opportunity to learn skills and content to practice and engage in scalable pattern discovery methods on massive transactional data, discuss pattern evaluation measures, and study methods for mining diverse kinds of patterns, sequential patterns, and sub-graph patterns.
Popular Internships and Jobs by Categories
Find Jobs & Internships
Browse


© 2024 BoostGrad | All rights reserved