Back to Courses


Data Science Courses - Page 75
Showing results 741-750 of 1407
Performing Network, Path, and Text Analyses in SAS Visual Analytics
In this course, you learn about the data structure needed for network, path, and text analytics and how to create network analysis, path analysis, and text analytics in SAS Visual Analytics.
Finding, Sorting, & Filtering Data in Microsoft Excel
In this project you will learn to use the searching, sorting, and filtering features of Microsoft Excel. Using the free version of Office 365’s Excel for the web, you will manipulate spreadsheet data to make it more useful for effective business decision-making. Using a filter, you’ll isolate just the data needed. You can then sort it into a logical sequence that can turn data into the information needed for effective decision making.
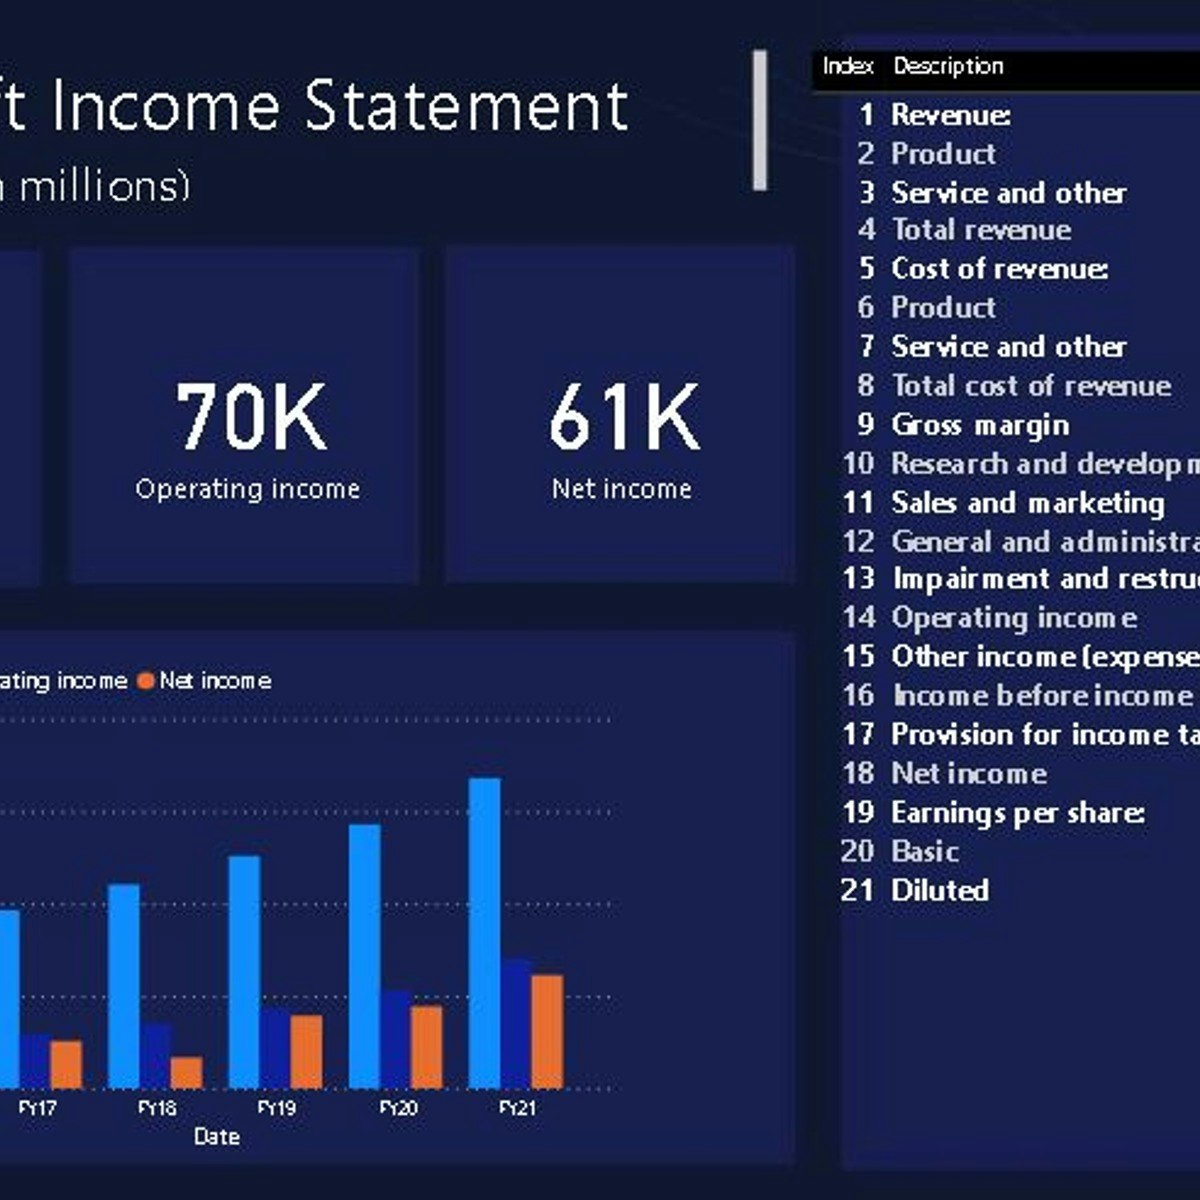
Build an Income Statement Dashboard in Power BI
In this 1.5 hours long project, we will be creating an income statement dashboard filled with relevant charts and data. Power BI dashboards are an amazing way to visualize data and make them interactive. We will begin this guided project by importing the data and transforming it in the Power Query editor. We will then visualize the Income Statement using a table, visualize total revenue, operating income and net income using cards and in the final task visualize the year on year growth using clustered column charts. This project is for anyone who is interested in Power BI and data visualization and specially for those who work in accounts and finance departments. By the end of this course, you will be confident in creating financial statement dashboards with many different kinds of visualizations.
AI Applications in Marketing and Finance
In this course, you will learn about AI-powered applications that can enhance the customer journey and extend the customer lifecycle. You will learn how this AI-powered data can enable you to analyze consumer habits and maximize their potential to target your marketing to the right people. You will also learn about fraud, credit risks, and how AI applications can also help you combat the ever-challenging landscape of protecting consumer data. You will also learn methods to utilize supervised and unsupervised machine learning to enhance your fraud detection methods. You will also hear from leading industry experts in the world of data analytics, marketing, and fraud prevention. By the end of this course, you will have a substantial understanding of the role AI and Machine Learning play when it comes to consumer habits, and how we are able to interact and analyze information to increase deep learning potential for your business.
Conditional Formatting, Tables and Charts in Microsoft Excel
In this project, you will learn how to analyze data and identify trends using a variety of tools in Microsoft Excel. Conditional formatting and charts are two tools that focus on highlighting and representing data in a visual form. With conditional formatting, you can define rules to highlight cells using a range of color scales and icons and to help you analyze data and identify trends or outliers. You will then use PivotTables to create summaries of the data that focuses on specific relationships which you will represent as a line chart and column chart. Both conditional formatting and charts are two useful ways of visually analyzing data and exploring trends.
Ethical Issues in Data Science
Computing applications involving large amounts of data – the domain of data science – impact the lives of most people in the U.S. and the world. These impacts include recommendations made to us by internet-based systems, information that is available about us online, techniques that are used for security and surveillance, data that is used in health care, and many more. In many cases, they are affected by techniques in artificial intelligence and machine learning.
This course examines some of the ethical issues related to data science, with the fundamental objective of making data science professionals aware of and sensitive to ethical considerations that may arise in their careers. It does this through a combination of discussion of ethical frameworks, examination of a variety of data science applications that lead to ethical considerations, reading current media and scholarly articles, and drawing upon the perspectives and experiences of fellow students and computing professionals.
Ethical Issues in Data Science can be taken for academic credit as part of CU Boulder’s Master of Science in Data Science (MS-DS) degree offered on the Coursera platform. The MS-DS is an interdisciplinary degree that brings together faculty from CU Boulder’s departments of Applied Mathematics, Computer Science, Information Science, and others. With performance-based admissions and no application process, the MS-DS is ideal for individuals with a broad range of undergraduate education and/or professional experience in computer science, information science, mathematics, and statistics. Learn more about the MS-DS program at https://www.coursera.org/degrees/master-of-science-data-science-boulder.
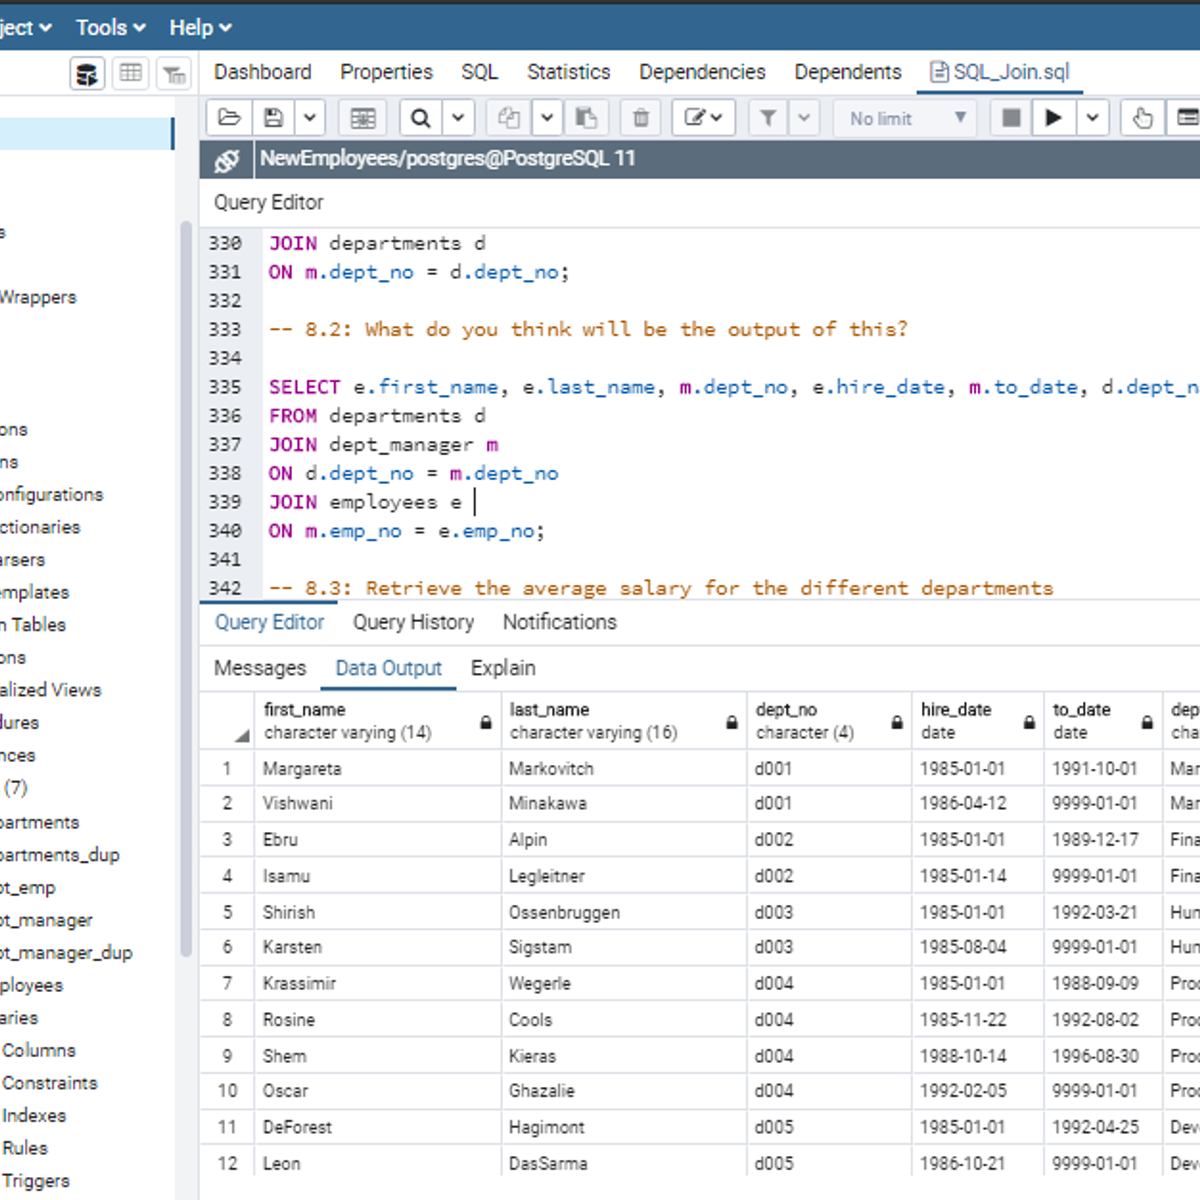
Mastering SQL Joins
In this 2-hour long project-based course, you will understand how to use SQL joins like INNER JOIN, LEFT JOIN, and RIGHT JOIN to get a desired result set. In addition, you will learn how to use SQL Joins with the WHERE clause and with aggregate functions. By extension, you will learn how to join more than two tables in the database.
Note: You do not need to be a data administrator or data analyst expert to be successful in this guided project, just you have to be familiar with querying databases using SQL SELECT statement to get the most of this project. If you are not familiar with SQL and want to learn the basics, start with my previous guided projects titled “Performing Data definition and Manipulation in SQL", “Querying Databases using SQL SELECT statement” and “Performing Data Aggregation using SQL Aggregate Functions”
Connect an App to a Cloud SQL for PostgreSQL Instance
This is a self-paced lab that takes place in the Google Cloud console. In this lab you will create a Kubernetes cluster and deploy a simple application to that cluster. Then, connect the application to the supplied Cloud SQL for PostgreSQL database instance and confirm that it is able to write to and read from it.
Getting Started with AI using IBM Watson
In this course you will learn how to quickly and easily get started with Artificial Intelligence using IBM Watson. You will understand how Watson works, become familiar with its use cases and real life client examples, and be introduced to several of Watson AI services from IBM that enable anyone to easily apply AI and build smart apps. You will also work with several Watson services to demonstrate AI in action.
This course does not require any programming or computer science expertise and is designed for anyone whether you have a technical background or not.
Bayesian Statistics: Techniques and Models
This is the second of a two-course sequence introducing the fundamentals of Bayesian statistics. It builds on the course Bayesian Statistics: From Concept to Data Analysis, which introduces Bayesian methods through use of simple conjugate models. Real-world data often require more sophisticated models to reach realistic conclusions. This course aims to expand our “Bayesian toolbox” with more general models, and computational techniques to fit them. In particular, we will introduce Markov chain Monte Carlo (MCMC) methods, which allow sampling from posterior distributions that have no analytical solution. We will use the open-source, freely available software R (some experience is assumed, e.g., completing the previous course in R) and JAGS (no experience required). We will learn how to construct, fit, assess, and compare Bayesian statistical models to answer scientific questions involving continuous, binary, and count data. This course combines lecture videos, computer demonstrations, readings, exercises, and discussion boards to create an active learning experience. The lectures provide some of the basic mathematical development, explanations of the statistical modeling process, and a few basic modeling techniques commonly used by statisticians. Computer demonstrations provide concrete, practical walkthroughs. Completion of this course will give you access to a wide range of Bayesian analytical tools, customizable to your data.
Popular Internships and Jobs by Categories
Find Jobs & Internships
Browse


© 2024 BoostGrad | All rights reserved