Back to Courses


Data Science Courses - Page 61
Showing results 601-610 of 1407
RPA Lifecycle: Development and Testing
To adopt RPA, you begin with the Discovery and Design phases and proceed onto the Development and Testing phase.
RPA Lifecycle – Development and Testing is the second course of the Specialization on Implementing RPA with Cognitive Solutions and Analytics.
In this course, you will learn how to develop and test bots. For this, you will use Automation Anywhere Enterprise Client (or AAE Client) to record, modify, and run tasks. AAE Client is a desktop application with an intuitive interface, that enables the creation of automated tasks with ease. It features ‘SMART’ Automation technology that quickly automates complex tasks without the need for any programming efforts. The learning will be reinforced through concept description, building bots, and guided practice.
Multiple Regression Analysis in Public Health
Biostatistics is the application of statistical reasoning to the life sciences, and it's the key to unlocking the data gathered by researchers and the evidence presented in the scientific public health literature. In this course, you'll extend simple regression to the prediction of a single outcome of interest on the basis of multiple variables. Along the way, you'll be introduced to a variety of methods, and you'll practice interpreting data and performing calculations on real data from published studies. Topics include multiple logistic regression, the Spline approach, confidence intervals, p-values, multiple Cox regression, adjustment, and effect modification.
Introduction to Predictive Modeling
Welcome to Introduction to Predictive Modeling, the first course in the University of Minnesota’s Analytics for Decision Making specialization.
This course will introduce to you the concepts, processes, and applications of predictive modeling, with a focus on linear regression and time series forecasting models and their practical use in Microsoft Excel. By the end of the course, you will be able to:
- Understand the concepts, processes, and applications of predictive modeling.
- Understand the structure of and intuition behind linear regression models.
- Be able to fit simple and multiple linear regression models to data, interpret the results, evaluate the goodness of fit, and use fitted models to make predictions.
- Understand the problem of overfitting and underfitting and be able to conduct simple model selection.
- Understand the concepts, processes, and applications of time series forecasting as a special type of predictive modeling.
- Be able to fit several time-series-forecasting models (e.g., exponential smoothing and Holt-Winter’s method) in Excel, evaluate the goodness of fit, and use fitted models to make forecasts.
- Understand different types of data and how they may be used in predictive models.
- Use Excel to prepare data for predictive modeling, including exploring data patterns, transforming data, and dealing with missing values.
This is an introductory course to predictive modeling. The course provides a combination of conceptual and hands-on learning. During the course, we will provide you opportunities to practice predictive modeling techniques on real-world datasets using Excel.
To succeed in this course, you should know basic math (the concept of functions, variables, and basic math notations such as summation and indices) and basic statistics (correlation, sample mean, standard deviation, and variance). This course does not require a background in programming, but you should be familiar with basic Excel operations (e.g., basic formulas and charting). For the best experience, you should have a recent version of Microsoft Excel installed on your computer (e.g., Excel 2013, 2016, 2019, or Office 365).
Aerial Image Segmentation with PyTorch
In this 2-hour project-based course, you will be able to :
- Understand the Massachusetts Roads Segmentation Dataset and you will write a custom dataset class for Image-mask dataset. Additionally, you will apply segmentation domain augmentations to augment images as well as its masks. For image-mask augmentation you will use albumentation library. You will plot the image-Mask pair.
- Load a pretrained state of the art convolutional neural network for segmentation problem(for e.g, Unet) using segmentation model pytorch library.
- Create train function and evaluator function which will helpful to write training loop. Moreover, you will use training loop to train the model.
- Finally, we will use best trained segementation model for inference.
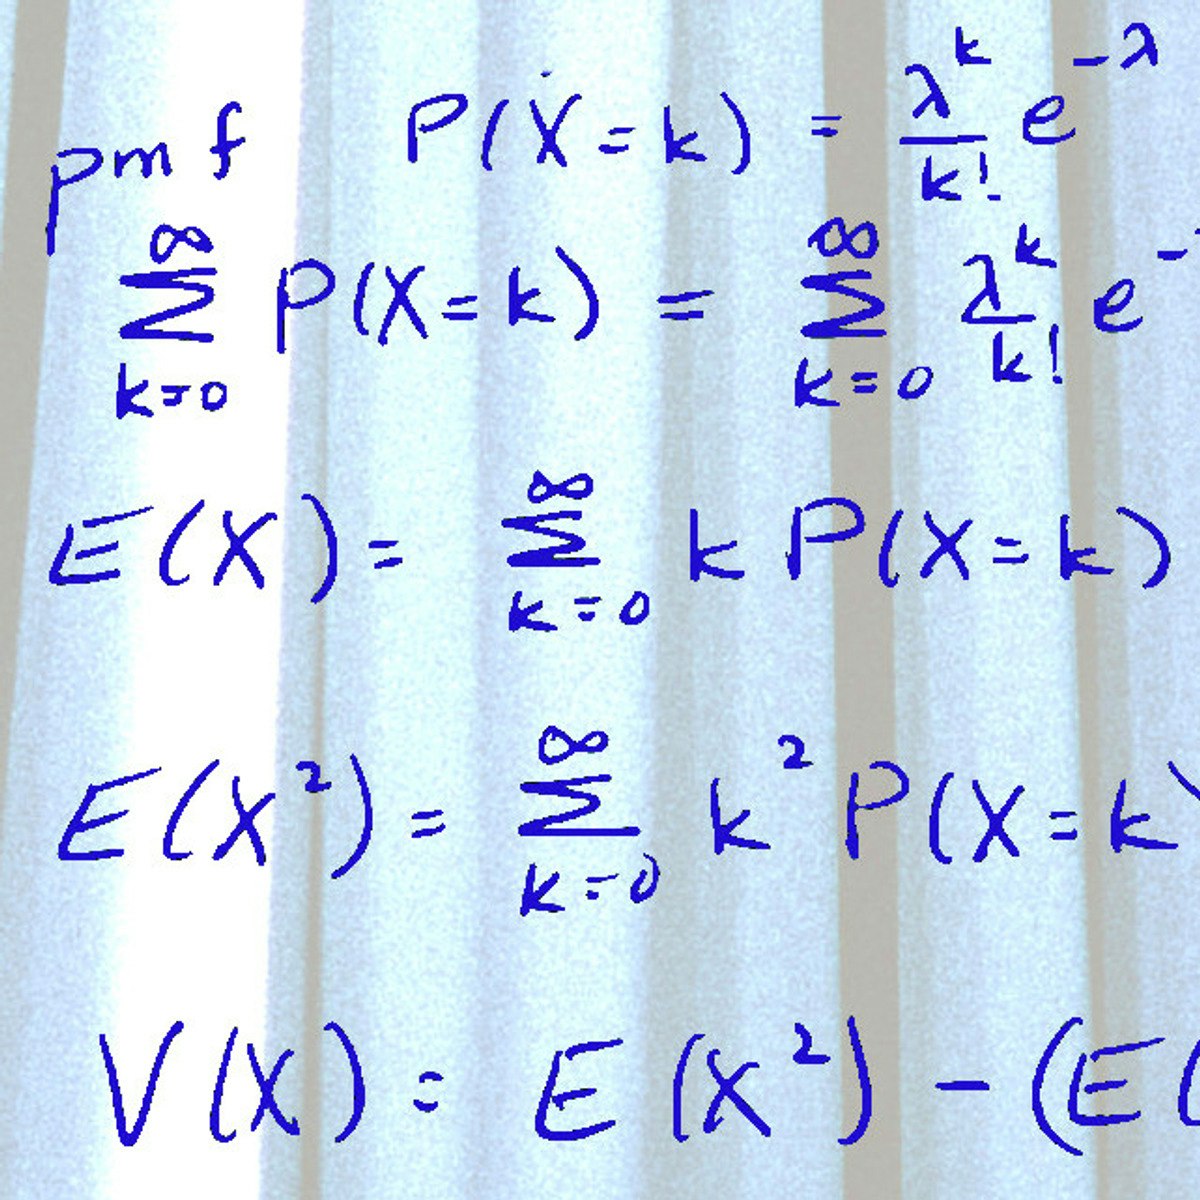
Statistical Inference for Estimation in Data Science
This course introduces statistical inference, sampling distributions, and confidence intervals. Students will learn how to define and construct good estimators, method of moments estimation, maximum likelihood estimation, and methods of constructing confidence intervals that will extend to more general settings.
This course can be taken for academic credit as part of CU Boulder’s Master of Science in Data Science (MS-DS) degree offered on the Coursera platform. The MS-DS is an interdisciplinary degree that brings together faculty from CU Boulder’s departments of Applied Mathematics, Computer Science, Information Science, and others. With performance-based admissions and no application process, the MS-DS is ideal for individuals with a broad range of undergraduate education and/or professional experience in computer science, information science, mathematics, and statistics. Learn more about the MS-DS program at https://www.coursera.org/degrees/master-of-science-data-science-boulder.
Logo adapted from photo by Christopher Burns on Unsplash.
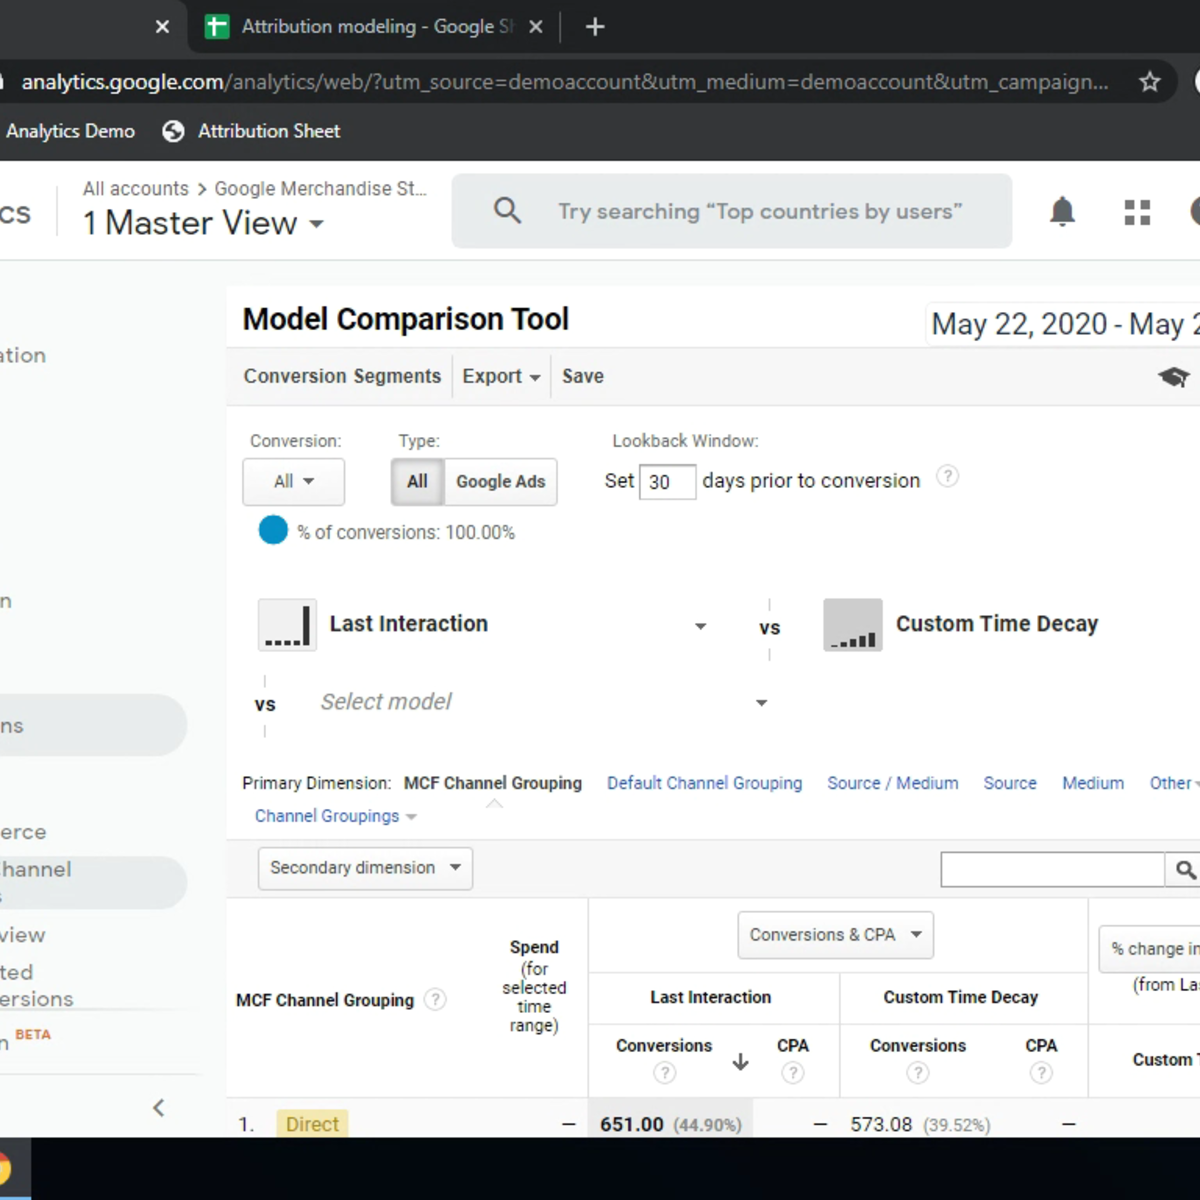
Custom Attribution Modeling with Google Analytics
In this 1-hour long project-based course, you will learn how to build and share a custom attribution model in Google Analytics, understand attribution modeling, export and import data for elaboration outside of Analytics platform.
Note: This course works best for learners who are based in the North America region. We’re currently working on providing the same experience in other regions.
Bayesian Statistics
This course describes Bayesian statistics, in which one's inferences about parameters or hypotheses are updated as evidence accumulates. You will learn to use Bayes’ rule to transform prior probabilities into posterior probabilities, and be introduced to the underlying theory and perspective of the Bayesian paradigm. The course will apply Bayesian methods to several practical problems, to show end-to-end Bayesian analyses that move from framing the question to building models to eliciting prior probabilities to implementing in R (free statistical software) the final posterior distribution. Additionally, the course will introduce credible regions, Bayesian comparisons of means and proportions, Bayesian regression and inference using multiple models, and discussion of Bayesian prediction.
We assume learners in this course have background knowledge equivalent to what is covered in the earlier three courses in this specialization: "Introduction to Probability and Data," "Inferential Statistics," and "Linear Regression and Modeling."
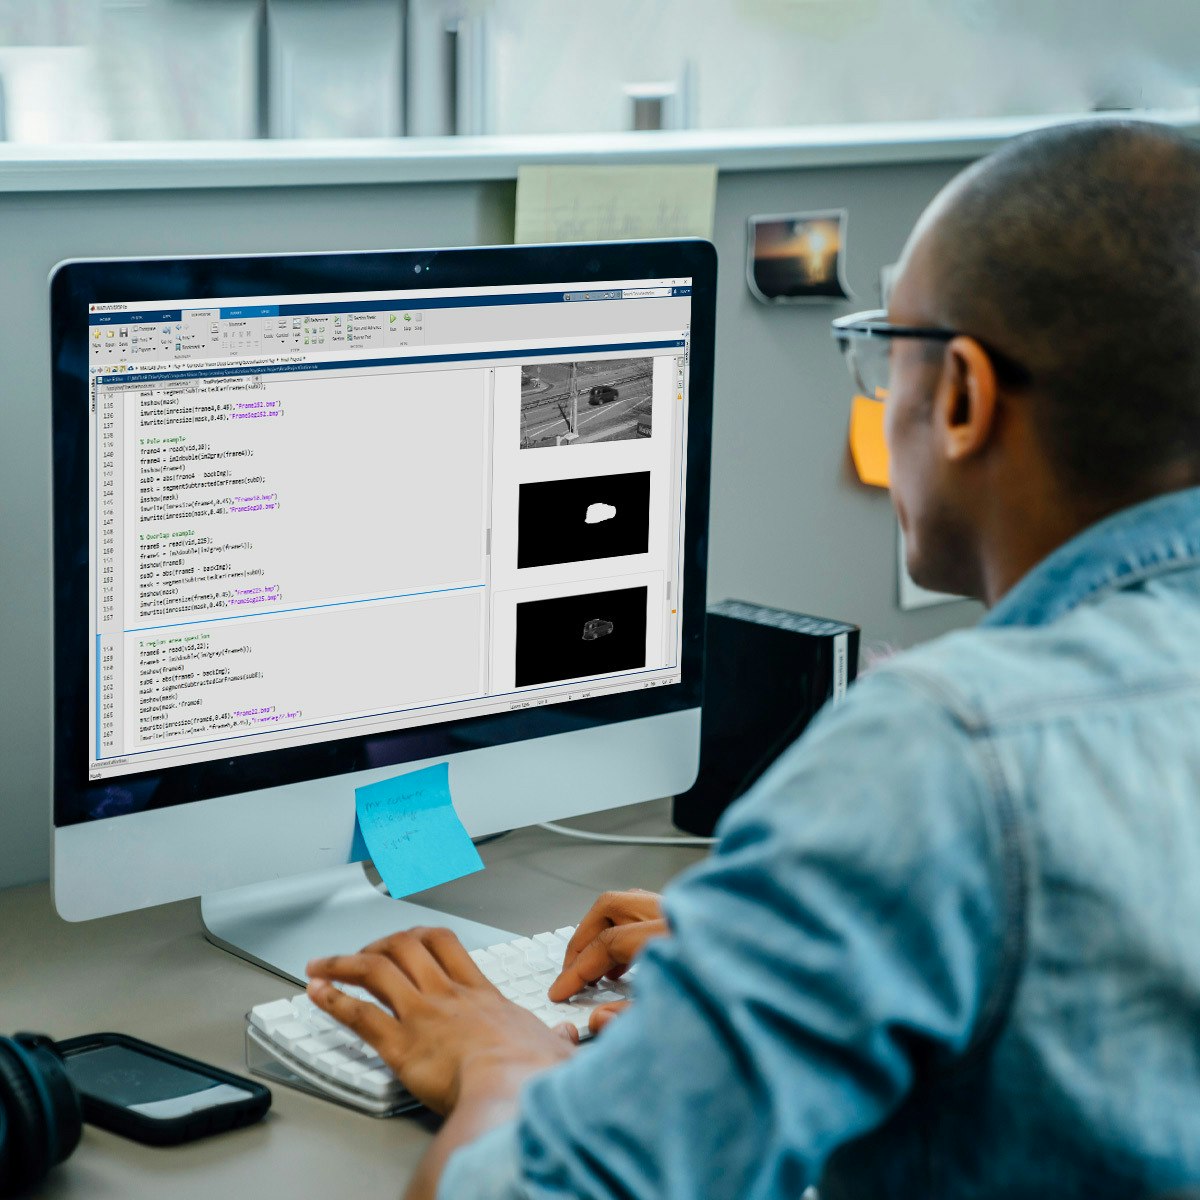
Automating Image Processing
In this course, you will build on the skills acquired in Image Segmentation, Filtering, and Region Analysis to explore large sets of images and video files. It’s impractical to manually inspect results in large data sets. Automating image processing allows you to do your work more efficiently.
At the end of this course, you’ll apply all the skills learned in this specialization to a final project. You’ll take the role of an engineer being asked to monitor traffic on a busy road. You’ll detect cars from a noisy video and analyze the results.
You will use MATLAB throughout this course. MATLAB is the go-to choice for millions of people working in engineering and science, and provides the capabilities you need to accomplish your image processing tasks. You will be provided with free access to MATLAB for the duration of the course to complete your work.
To be successful in this course you should have a background in basic math and some exposure to MATLAB. If you want to familiarize yourself with MATLAB check out the free, two-hour MATLAB Onramp. Experience with image processing is not required.
Creating dynamic SQL derived tables with LookML and Liquid
This is a Google Cloud Self-Paced Lab. In this lab you will learn how to create and update SQL derived tables to generate dynamic values.
The Pytorch basics you need to start your ML projects
In this 1-hour long project-based course, you will learn how to use simple commands to create and manipulate files and folders, perform multiple complex tasks using one simple command, use the superuser to perform high privilege operations.
Popular Internships and Jobs by Categories
Find Jobs & Internships
Browse


© 2024 BoostGrad | All rights reserved