Back to Courses


Data Science Courses - Page 26
Showing results 251-260 of 1407
Intermediate PostgreSQL
This course covers a wide range of SQL techniques, beyond basic CRUD (Create, Read, Update, and Delete) operations in PostgreSQL. You will learn the specifics of aggregation, transactions, reading and parsing CSV files and inserting data into a database. You’ll also take a look at how PostgreSQL handles and indexes text data.
Specifically, students will do assignments that alter table schemas, create stored procedures, construct advanced queries, explore sorting and grouping query data, and techniques for working with text in databases including regular expressions.
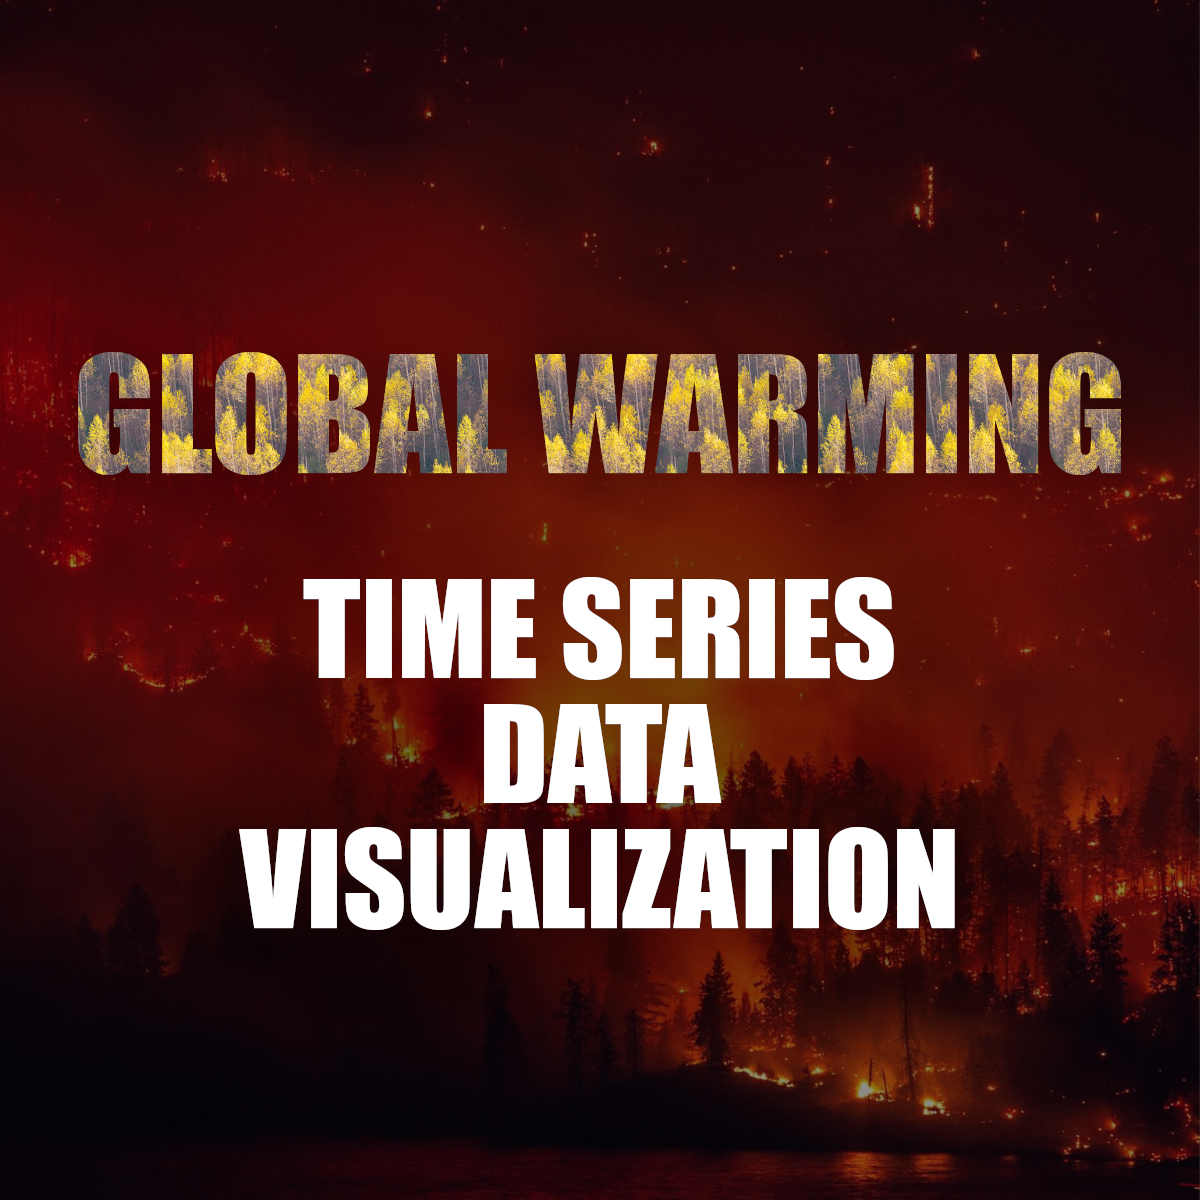
Time Series Data Visualization And Analysis Techniques
By the end of this project we will learn how to analyze time series data. We are going to talk about different visualization techniques for time series datasets and we are going to compare them in terms of the tasks that we can solve using each of them. Tasks such as outlier detection, Key moments detection and overall trend analysis. During this project, we will learn how and when to use Line charts, Bar charts, and Boxplot. We will also learn some techniques about color mapping and we will understand how it can help us for a better analysis and understanding of our data.
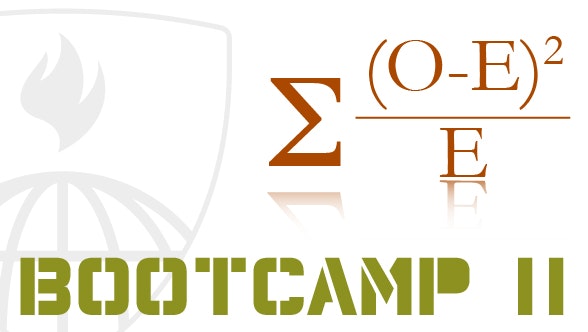
Mathematical Biostatistics Boot Camp 2
Learn fundamental concepts in data analysis and statistical inference, focusing on one and two independent samples.
Deploy Models with TensorFlow Serving and Flask
In this 2-hour long project-based course, you will learn how to deploy TensorFlow models using TensorFlow Serving and Docker, and you will create a simple web application with Flask which will serve as an interface to get predictions from the served TensorFlow model.
This course runs on Coursera's hands-on project platform called Rhyme. On Rhyme, you do projects in a hands-on manner in your browser. You will get instant access to pre-configured cloud desktops containing all of the software and data you need for the project. Everything is already set up directly in your Internet browser so you can just focus on learning. For this project, you’ll get instant access to a cloud desktop with (e.g. Python, Jupyter, and Tensorflow) pre-installed.
Prerequisites:
In order to be successful in this project, you should be familiar with Python, TensorFlow, Flask, and HTML.
Notes:
- You will be able to access the cloud desktop 5 times. However, you will be able to access instructions videos as many times as you want.
- This course works best for learners who are based in the North America region. We’re currently working on providing the same experience in other regions.
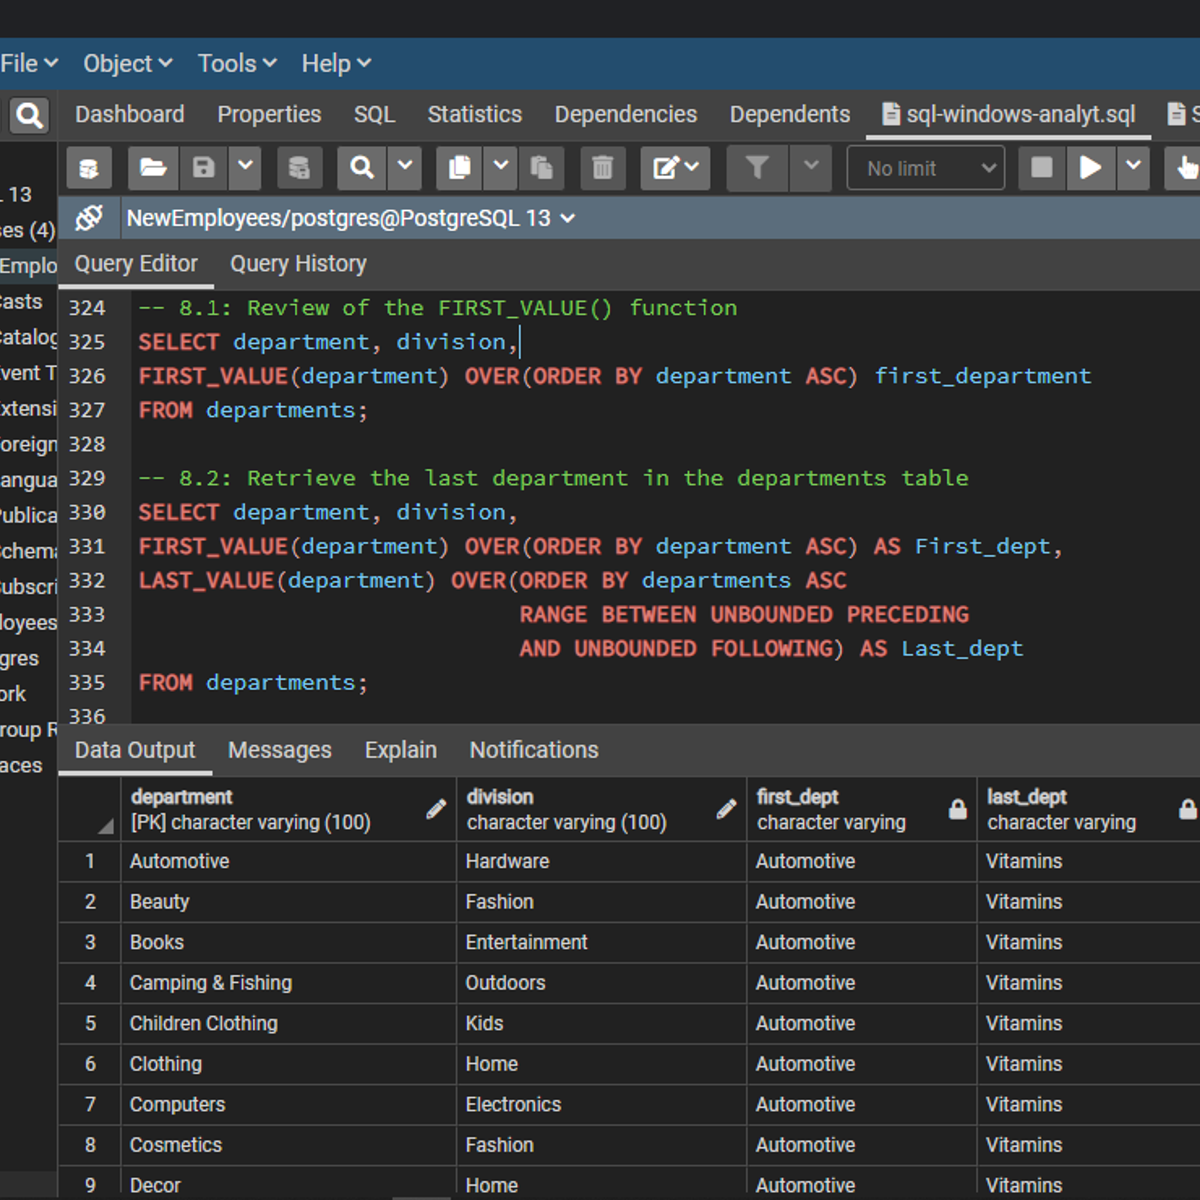
SQL Window Functions for Analytics
Welcome to this project-based course SQL Window Functions for Analytics. This is a hands-on project that will help SQL users use window functions extensively for database insights. In this project, you will learn how to explore and query the project-db database extensively. We will start this hands-on project by retrieving the data in the table in the database.
By the end of this 2-hour-and-a-half-long project, you will be able to use different window functions to retrieve the desired result from a database. In this project, you will learn how to use SQL window functions like ROW_NUMBER(), RANK(), DENSE_RANK(), NTILE(), and LAST_VALUE() to manipulate data in the project-db database. Also, we will consider how to use aggregate window functions. These window functions will be used together with the OVER() clause to query this database. By extension, we will use grouping functions like GROUPING SETS(), ROLLUP(), and CUBE() to retrieve sublevel and grand totals.
Cloud Machine Learning Engineering and MLOps
Welcome to the fourth course in the Building Cloud Computing Solutions at Scale Specialization! In this course, you will build upon the Cloud computing and data engineering concepts introduced in the first three courses to apply Machine Learning Engineering to real-world projects. First, you will develop Machine Learning Engineering applications and use software development best practices to create Machine Learning Engineering applications. Then, you will learn to use AutoML to solve problems more efficiently than traditional machine learning approaches alone. Finally, you will dive into emerging topics in Machine Learning including MLOps, Edge Machine Learning and AI APIs.
This course is ideal for beginners as well as intermediate students interested in applying Cloud computing to data science, machine learning and data engineering. Students should have beginner level Linux and intermediate level Python skills. For your project in this course, you will build a Flask web application that serves out Machine Learning predictions.
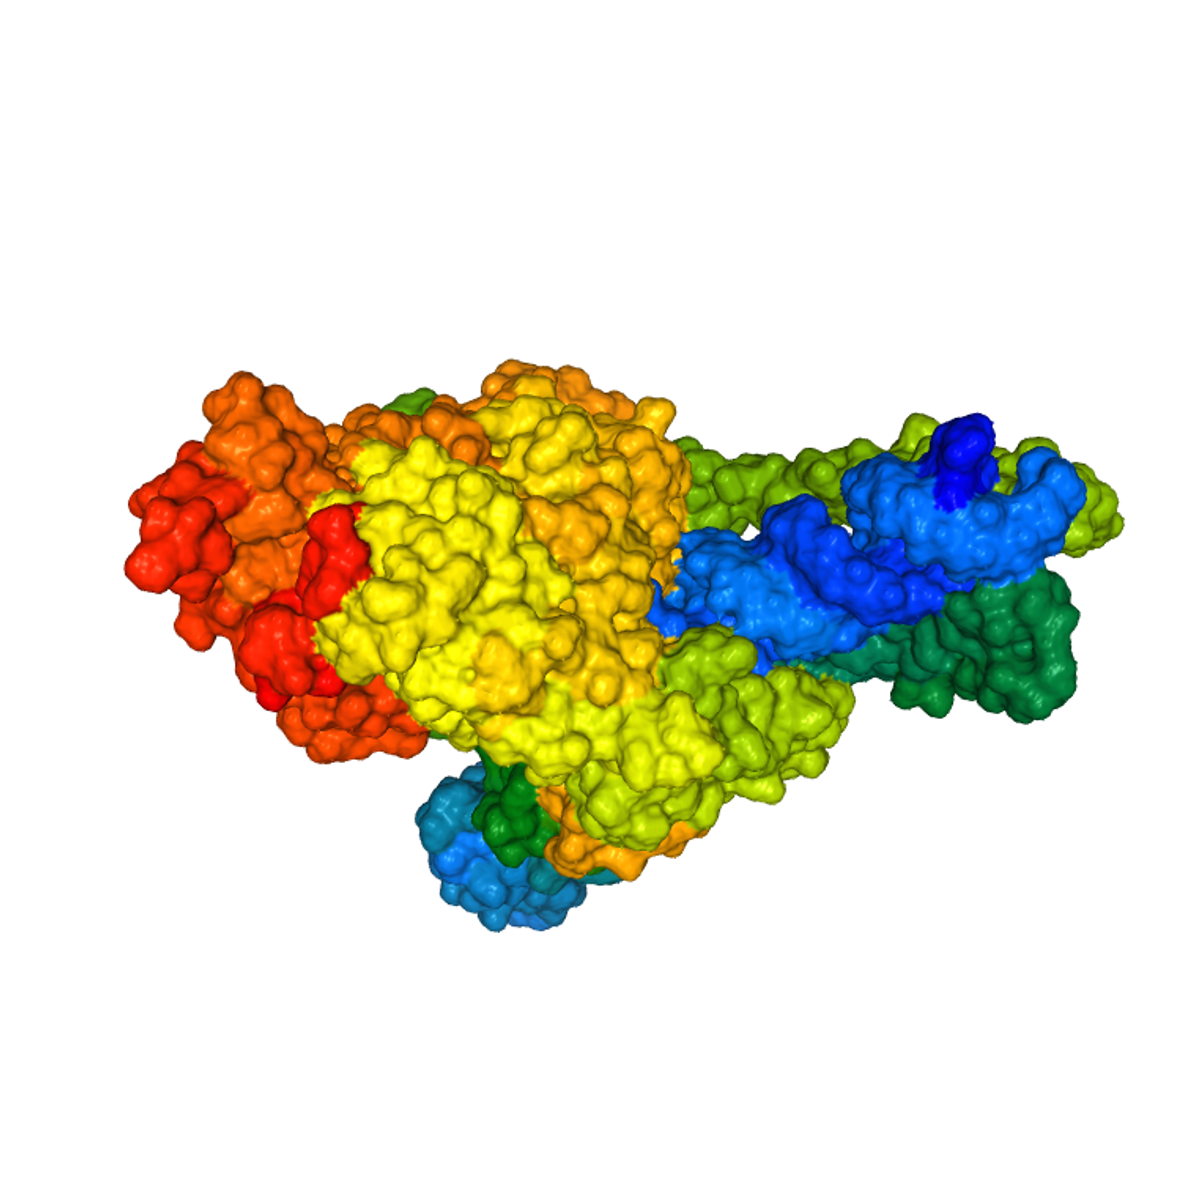
3D SARS-CoV-19 Protein Visualization With Biopython
In this project you will create an interactive three-dimensional (3D) representation of SARS-CoV-19 (Coronavirus) protein structures & publication-quality pictures of the same, understand properties of SARS-CoV-19 genome, handle biological sequence data stored in FASTA & PDB (Protein Data Bank) and XML format, and get insights from this data using Biopython. This hands-on project will also give you a glimpse of tasks a Bioinformatician performs on a daily basis, along with the up-to-date concepts and database use cases in the field of Medical Research and Human genetics.
In this project, we will also cover basics about important databases used by biologists and biotechnologists, along with the type of sequence data we can access and visualize from these databases using Biopython & Jupyter notebook.
Global Statistics - Composite Indices for International Comparisons
The number of composite indices that are constructed and used internationally is growing very fast; but whilst the complexity of quantitative techniques has increased dramatically, the education and training in this area has been dragging and lagging behind. As a consequence, these simple numbers, expected to synthesize quite complex issues, are often presented to the public and used in the political debate without proper emphasis on their intrinsic limitations and correct interpretations.
In this course on global statistics, offered by the University of Geneva jointly with the ETH Zürich KOF, you will learn the general approach of constructing composite indices and some of resulting problems. We will discuss the technical properties, the internal structure (like aggregation, weighting, stability of time series), the primary data used and the variable selection methods. These concepts will be illustrated using a sample of the most popular composite indices. We will try to address not only statistical questions but also focus on the distinction between policy-, media- and paradigm-driven indicators.
Joining Data in R using dplyr
You will need to join or merge two or more data sets at different points in your work as a data enthusiast. The dplyr package offers very sophisticated functions to help you achieve the join operation you desire. This project-based course, "Joining Data in R using dplyr" is for R users willing to advance their knowledge and skills.
In this course, you will learn practical ways for data manipulation in R. We will talk about different join operations and spend a great deal of our time here joining the sales and customers data sets using the dplyr package. By the end of this 2-hour-long project, you will perform inner join, full (outer) join, right join, left join, cross join, semi join, and anti join using the merge() and dplyr functions.
This project-based course is an intermediate-level course in R. Therefore, to get the most of this project, it is essential to have prior experience using R for basic analysis. I recommend that you complete the project titled: "Data Manipulation with dplyr in R" before you take this current project.
Mastering Data Analysis with Pandas: Learning Path Part 3
In this structured series of hands-on guided projects, we will master the fundamentals of data analysis and manipulation with Pandas and Python. Pandas is a super powerful, fast, flexible and easy to use open-source data analysis and manipulation tool. This guided project is the third of a series of multiple guided projects (learning path) that is designed for anyone who wants to master data analysis with pandas.
Note: This course works best for learners who are based in the North America region. We’re currently working on providing the same experience in other regions.
Popular Internships and Jobs by Categories
Find Jobs & Internships
Browse


© 2024 BoostGrad | All rights reserved