Back to Courses


Data Science Courses - Page 25
Showing results 241-250 of 1407
Machine Learning for Investment Professionals
This course is uniquely tailored to the needs of investment professionals or those with investment industry knowledge who want to develop a basic, practical understanding of machine learning techniques and how they are used in the investment process. Incorporating real-life case studies, this course covers both the technical and the “soft skills” necessary for investment professionals to stay relevant.
In this course, you will learn how to:
- Distinguish between supervised and unsupervised machine learning and deep learning
- Describe how machine learning algorithm performance is evaluated
- Describe supervised and unsupervised machine learning algorithms and determine the problems they are best suited for
- Describe neural networks, deep learning nets, and reinforcement learning
- Choose an appropriate machine learning algorithm
- Describe the value of integrating machine learning and data projects in the investment process
- Work with data scientists and investment teams to harness information and insights from within large and alternative data sets
- Apply the CFA Institute Ethical Decision-Making Framework to machine learning dilemmas
This course is part of the Data Science for Investment Professionals Specialization offered by CFA Institute.
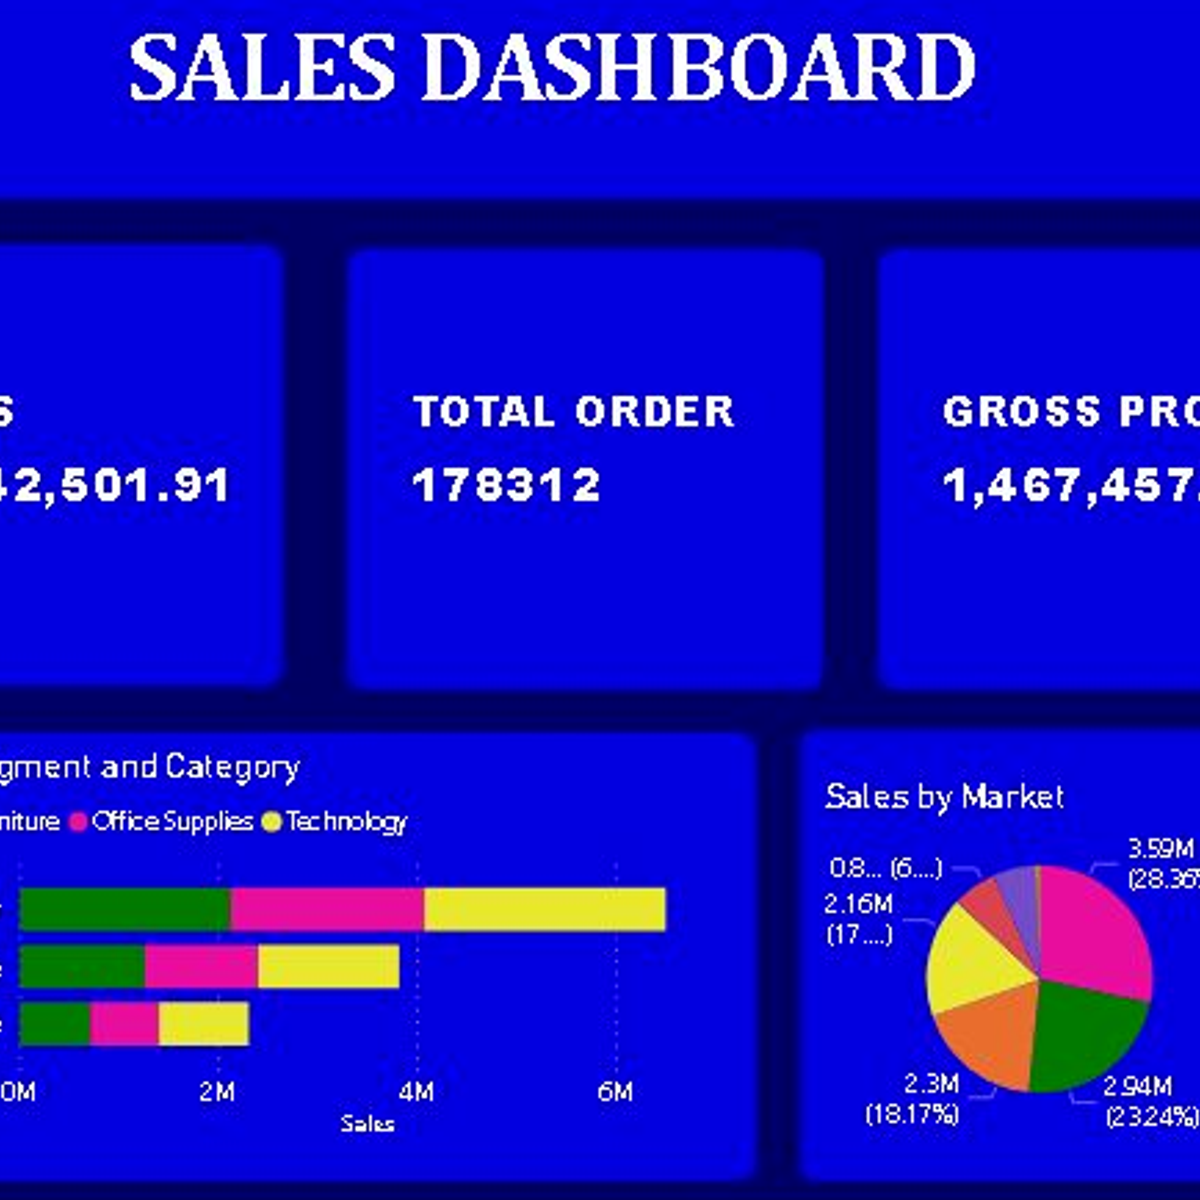
Create a Sales Dashboard using Power BI
In this 1 hour long project, you will build an attractive and eye-catching sales dashboard using Power BI in a black and blue theme that will make your audience go "wow". We will begin this guided project by importing data. We will then create bar charts and pie charts to visualize the sales data and then position the graphs on the dashboard. In the final tasks, we will create interactive maps to visualize sales data by countries and markets. By the end of this course, you will be confident in creating beautiful dashboards with many different kinds of visualizations.
Building a Fraud Detection Model with Vertex AI AutoML
This is a self-paced lab that takes place in the Google Cloud console.
In this lab you will use Vertex AI to train and serve a model with tabular data. You will build a fraud detection model to determine whether a particular credit card transaction should be classified as fraudulent.
Recommendation Systems on Google Cloud
In this course, you apply your knowledge of classification models and embeddings to build a ML pipeline that functions as a recommendation engine.
This is the fifth and final course of the Advanced Machine Learning on Google Cloud series.
Interviewing, Negotiating a Job Offer, and Career Planning
Prepare yourself for interviewing and landing a job in the DS/AI field. In this course, we will discuss what needs to be done before, during, and after the interview process. We will also provide tips and tricks on how to practice for a major component of data science interviews: the technical interview. Finally, this course will cover best practices for accepting or declining a job offer, salary negotiations, and how to create a career development plan.
By the end of this course, students will be able to:
• Recall what actions need to be done before, during, and after an interview.
• Discuss a technical interview preparation plan.
• Identify job offer acceptance or refusal best practices.
• Create a career development plan.
Visualization of UK accidents using Plotly Express
In this 1.5-hour long project-based course, you will learn to Visualize the data of UK accidents using Plotly Express. This project gives detailed insights into United Kingdom (UK) long-term road accident trends between 2005 - 2014. We are going to visualize:
1. What is the rate of road accidents (i.e. the number of casualties) in the UK between 2005 - 2014?
2. What is the rate of road accidents based on weekdays?
3. How is the distribution of accident severity in the UK, from 2005 - 2014? 5. Which speed limit is closely associated with road accidents in the UK, from 2005 - 2014? 6. Which road type has the highest rate of road accidents between 2005 - 2014?
By the end of this project, you will learn to set up Google Colab. You'll be able to download the UK accidents dataset directly from the Kaggle Platform on the Colab using Kaggle API. You'll visualize potential casualties due to road accidents, distribution of accident severity that may be either a serious accident, fatal accident, or a slight accident type. You will also visualize how speed limit is associated with the road accidents and see which road type has the highest rate of road accidents.
You must have a basic knowledge of Python Programming Language. You'll need a free Gmail account to complete this project.
Note: This course works best for learners who are based in the North America region. We’re currently working on providing the same experience in other regions.
Data Visualization Best Practices
In this course, we will cover the basics of visualization and how it fits into the Data Science workflow. We will focus on the main concepts behind the purpose of visualization and the design principles for creating effective, easy-to-communicate results. You will also set up your Tableau environment, practice data loading, and perform univariate descriptive analysis of the S&P 500 stock sectors.
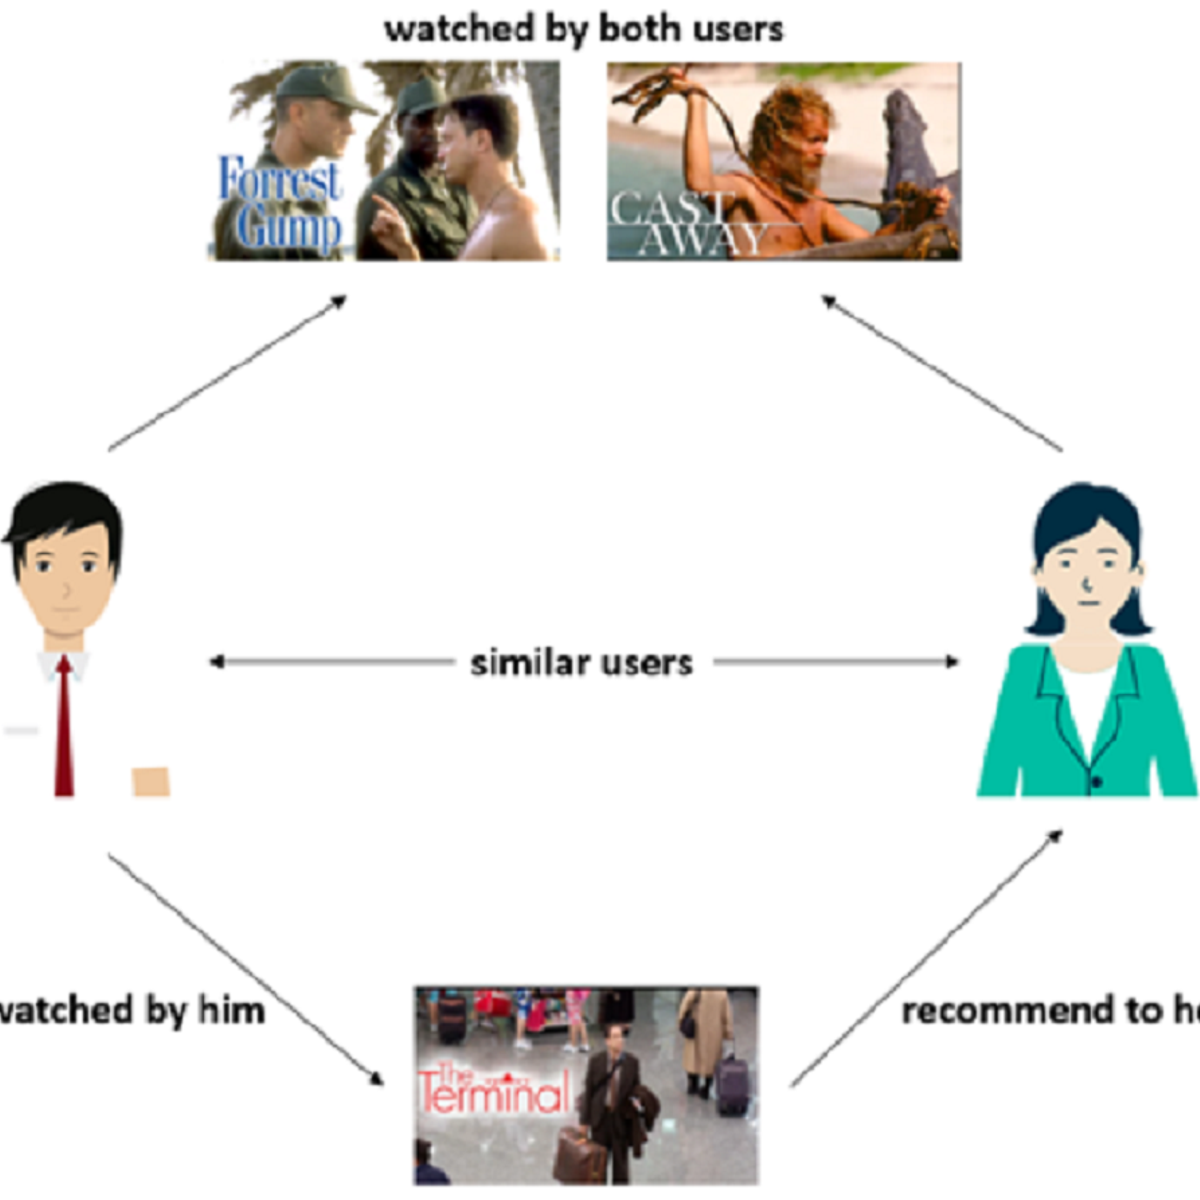
Building Similarity Based Recommendation System
Welcome to this 1-hour project-based course on Building Similarity Based Recommendation System. In this project, you will learn how similarity based collaborative filtering recommendation systems work, how you can collect data for building such systems. You will learn what are some different ways you to compute similarity between users and recommend items based on products interacted by other similar users. You will learn to create user item interactions matrix from the original dataset and also how to recommend items to a new user who does not have any historical interactions with the items.
Note: This course works best for learners who are based in the North America region. We’re currently working on providing the same experience in other regions.
Four Rare Machine Learning Skills All Data Scientists Need
This course covers the most neglected yet critical skills in machine learning, four vital techniques that are very rarely covered – most courses and books omit them entirely.
1) UPLIFT MODELING (AKA PERSUASION MODELING): When you're modeling, are you even predicting the right thing?
2) THE ACCURACY FALLACY: When evaluating how well a model works, are you even reporting on the right thing?
3) P-HACKING: Are your simplest discoveries from data even real?
4) THE PARADOX OF ENSEMBLE MODELS: Do you understand how they work, even though they seem to defy Occam's Razor?
>> WHY THESE ADVANCED METHODS ARE ESSENTIAL: Each one addresses a question that is fundamental to machine learning (above). For many projects, success hinges on these particular skills.
>> NO HANDS-ON – BUT FOR TECHNICAL LEARNERS: This course has no coding and no use of machine learning software. Instead, it lays the conceptual groundwork before you take on the hands-on practice. When it comes to these state-of-the-art techniques and prevalent pitfalls, there's a foundation of conceptual knowledge to build before going hands-on – and you'll be glad you did.
>> VENDOR-NEUTRAL: This course includes illuminating software demos of machine learning in action using SAS products. However, the curriculum is vendor-neutral and universally-applicable. The contents and learning objectives apply, regardless of which machine learning software tools you end up choosing to work with.
Data-driven Astronomy
Science is undergoing a data explosion, and astronomy is leading the way. Modern telescopes produce terabytes of data per observation, and the simulations required to model our observable Universe push supercomputers to their limits. To analyse this data scientists need to be able to think computationally to solve problems. In this course you will investigate the challenges of working with large datasets: how to implement algorithms that work; how to use databases to manage your data; and how to learn from your data with machine learning tools. The focus is on practical skills - all the activities will be done in Python 3, a modern programming language used throughout astronomy.
Regardless of whether you’re already a scientist, studying to become one, or just interested in how modern astronomy works ‘under the bonnet’, this course will help you explore astronomy: from planets, to pulsars to black holes.
Course outline:
Week 1: Thinking about data
- Principles of computational thinking
- Discovering pulsars in radio images
Week 2: Big data makes things slow
- How to work out the time complexity of algorithms
- Exploring the black holes at the centres of massive galaxies
Week 3: Querying data using SQL
- How to use databases to analyse your data
- Investigating exoplanets in other solar systems
Week 4: Managing your data
- How to set up databases to manage your data
- Exploring the lifecycle of stars in our Galaxy
Week 5: Learning from data: regression
- Using machine learning tools to investigate your data
- Calculating the redshifts of distant galaxies
Week 6: Learning from data: classification
- Using machine learning tools to classify your data
- Investigating different types of galaxies
Each week will also have an interview with a data-driven astronomy expert.
Note that some knowledge of Python is assumed, including variables, control structures, data structures, functions, and working with files.
Popular Internships and Jobs by Categories
Find Jobs & Internships
Browse


© 2024 BoostGrad | All rights reserved