Back to Courses


Data Science Courses - Page 23
Showing results 221-230 of 1407
Data science perspectives on pandemic management
The COVID-19 pandemic is one of the first world-wide scenarios where data made a difference in capturing and analyzing the diffusion and impact of the disease.
We offer an introductory course for decision makers, policy makers, public bodies, NGOs, and private organizations about methods, tools, and experiences on the use of data for managing current and future pandemic scenarios.
This course describes modern methods for data-driven policy making in the context of pandemics. Discussed methods include policy making, innovation, and technology governance; data collection from citizens, crowdsourcing, gamification, and game with a purpose (GWAP); crowd monitoring and sensing; mobility and traffic analysis; disinformation and fake news impacts; and economical and financial impacts and sustainability models. Methods, tools, and analyses are presented to demonstrate how data can help in designing better solutions to pandemics and world-wide critical events.
In this course you will discover the role of policy making and technology governance for managing pandemics.
You will learn about methods like crowdsourcing, gamification, sensing of crowds and built environments, and contact tracing for understanding the dynamics of the pandemic.
You will understand the risk of disinformation and its impact on people perception and decisions.
The course also covers the financial models that describe the pandemic monetary impact on individuals and organizations, as well as the financial sustainability models that can be defined.
Thanks to this course you will get a deeper understanding of motivations, perceptions, choices, and actions of individuals in a pandemic setting, and you will be able to start defining appropriate mitigation actions.
This course was developed by a set of European research and education institutions as part of the research project 'Pan-European Response to the Impacts of the COVID-19 and future Pandemics and Epidemics' (PERISCOPE, https://www.periscopeproject.eu/). Funded by the European Commission Research Funding programme Horizon 2020 under the Grant Agreement number 101016233, PERISCOPE investigates the broad socio-economic and behavioural impacts of the COVID-19 pandemic, to make Europe more resilient and prepared for future large-scale risks.
Relational Database Support for Data Warehouses
Relational Database Support for Data Warehouses is the third course in the Data Warehousing for Business Intelligence specialization. In this course, you'll use analytical elements of SQL for answering business intelligence questions. You'll learn features of relational database management systems for managing summary data commonly used in business intelligence reporting. Because of the importance and difficulty of managing implementations of data warehouses, we'll also delve into storage architectures, scalable parallel processing, data governance, and big data impacts. In the assignments in this course, you can use either Oracle or PostgreSQL.
Using DAX throughout PowerBI to create robust data scenarios
If you don't use Data Analysis Expressions (DAX) Language, you will miss out on 95% of Power BI's potential as a fantastic analytical tool, and the journey to becoming a DAX master starts with the right step. This project-based course, "Using DAX throughout Power BI to create robust data scenarios," is intended for novice data analysts willing to advance their knowledge and skills.
This 2-hour project-based course will teach you how to create columns, measures, and tables using DAX codes while understanding the importance of context in DAX formulas. Finally, we'll round off the course by introducing time-intelligence functions and show you how to use Quick Measures to create complex DAX code. This course is structured in a systematic way and very practical, where you get an option to practice as you progress.
This project-based course is a beginner-level course in Power BI. Therefore, you should be familiar with the Power BI interface to get the most out of this project. Please join me on this beautiful ride! Let's take the first step in your DAX mastery journey!
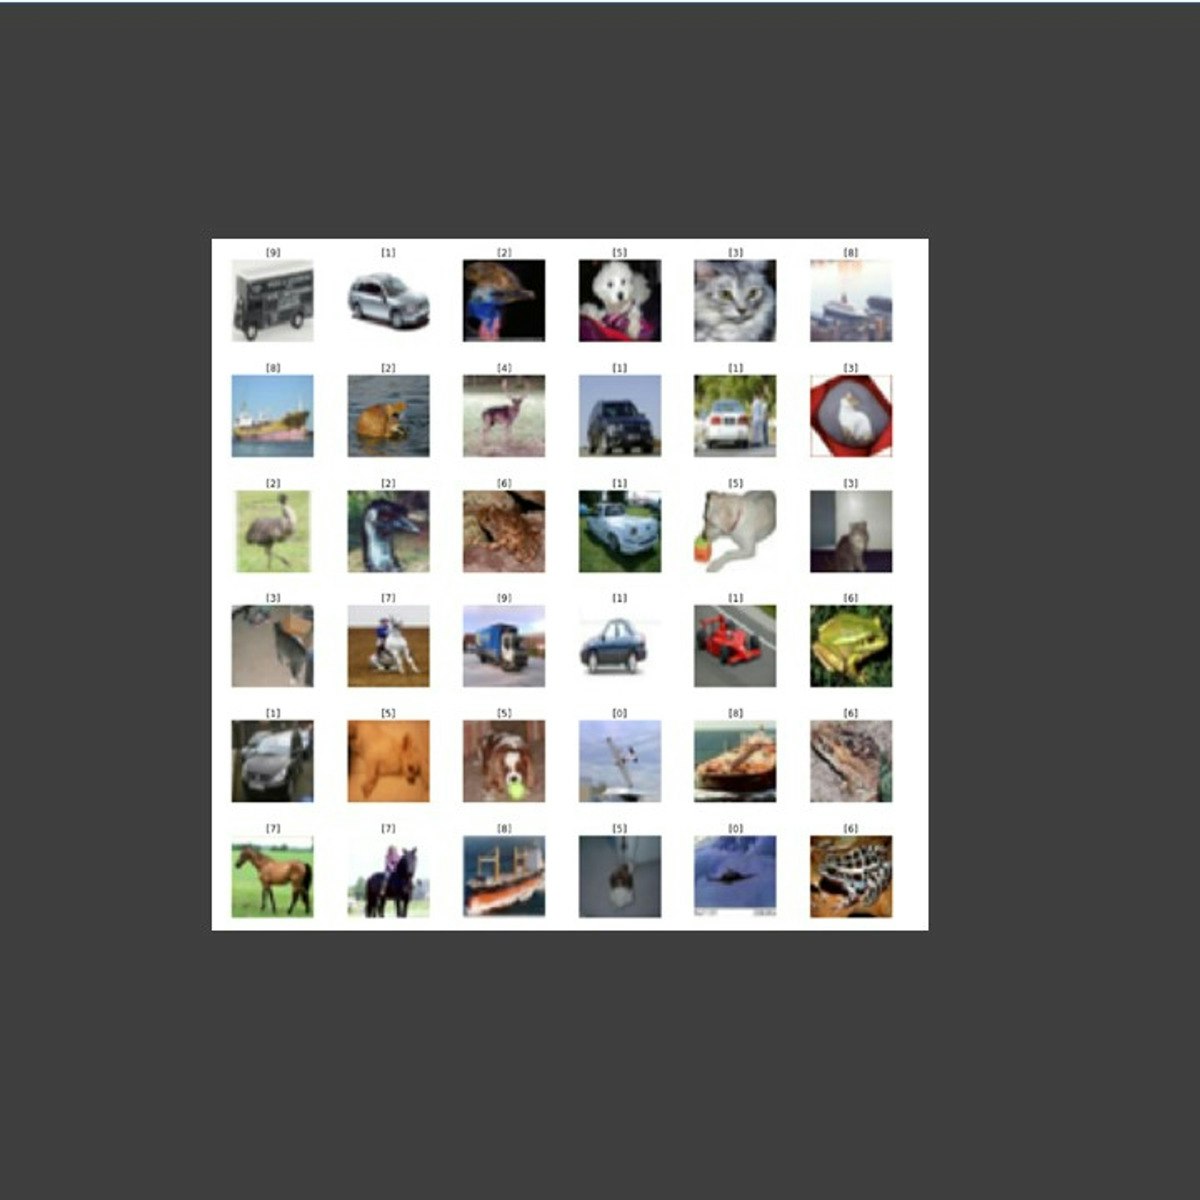
Cifar-10 Image Classification with Keras and Tensorflow 2.0
In this guided project, we will build, train, and test a deep neural network model to classify low-resolution images containing airplanes, cars, birds, cats, ships, and trucks in Keras and Tensorflow 2.0. We will use Cifar-10 which is a benchmark dataset that stands for the Canadian Institute For Advanced Research (CIFAR) and contains 60,000 32x32 color images. This project is practical and directly applicable to many industries.
Bayesian Statistics: Mixture Models
Bayesian Statistics: Mixture Models introduces you to an important class of statistical models. The course is organized in five modules, each of which contains lecture videos, short quizzes, background reading, discussion prompts, and one or more peer-reviewed assignments. Statistics is best learned by doing it, not just watching a video, so the course is structured to help you learn through application.
Some exercises require the use of R, a freely-available statistical software package. A brief tutorial is provided, but we encourage you to take advantage of the many other resources online for learning R if you are interested.
This is an intermediate-level course, and it was designed to be the third in UC Santa Cruz's series on Bayesian statistics, after Herbie Lee's "Bayesian Statistics: From Concept to Data Analysis" and Matthew Heiner's "Bayesian Statistics: Techniques and Models." To succeed in the course, you should have some knowledge of and comfort with calculus-based probability, principles of maximum-likelihood estimation, and Bayesian estimation.
Exploring and Producing Data for Business Decision Making
This course provides an analytical framework to help you evaluate key problems in a structured fashion and will equip you with tools to better manage the uncertainties that pervade and complicate business processes. Specifically, you will learn how to summarize data and learn concepts of frequency, normal distribution, statistical studies, sampling, and confidence intervals.
While you will be introduced to some of the science of what is being taught, the focus will be on applying the methodologies. This will be accomplished through the use of Excel and data sets from different disciplines, allowing you to see the use of statistics in a range of settings. The course will focus not only on explaining these concepts, but also understanding and interpreting the results obtained.
You will be able to:
• Summarize large data sets in graphical, tabular, and numerical forms
• Understand the significance of proper sampling and why one can rely on sample information
• Understand why normal distribution can be used in a wide range of settings
• Use sample information to make inferences about the population with a certain level of confidence about the accuracy of the estimations
• Use Excel for statistical analysis
This course is part of Gies College of Business’ suite of online programs, including the iMBA and iMSM. Learn more about admission into these programs and explore how your Coursera work can be leveraged if accepted into a degree program at https://degrees.giesbusiness.illinois.edu/idegrees/.
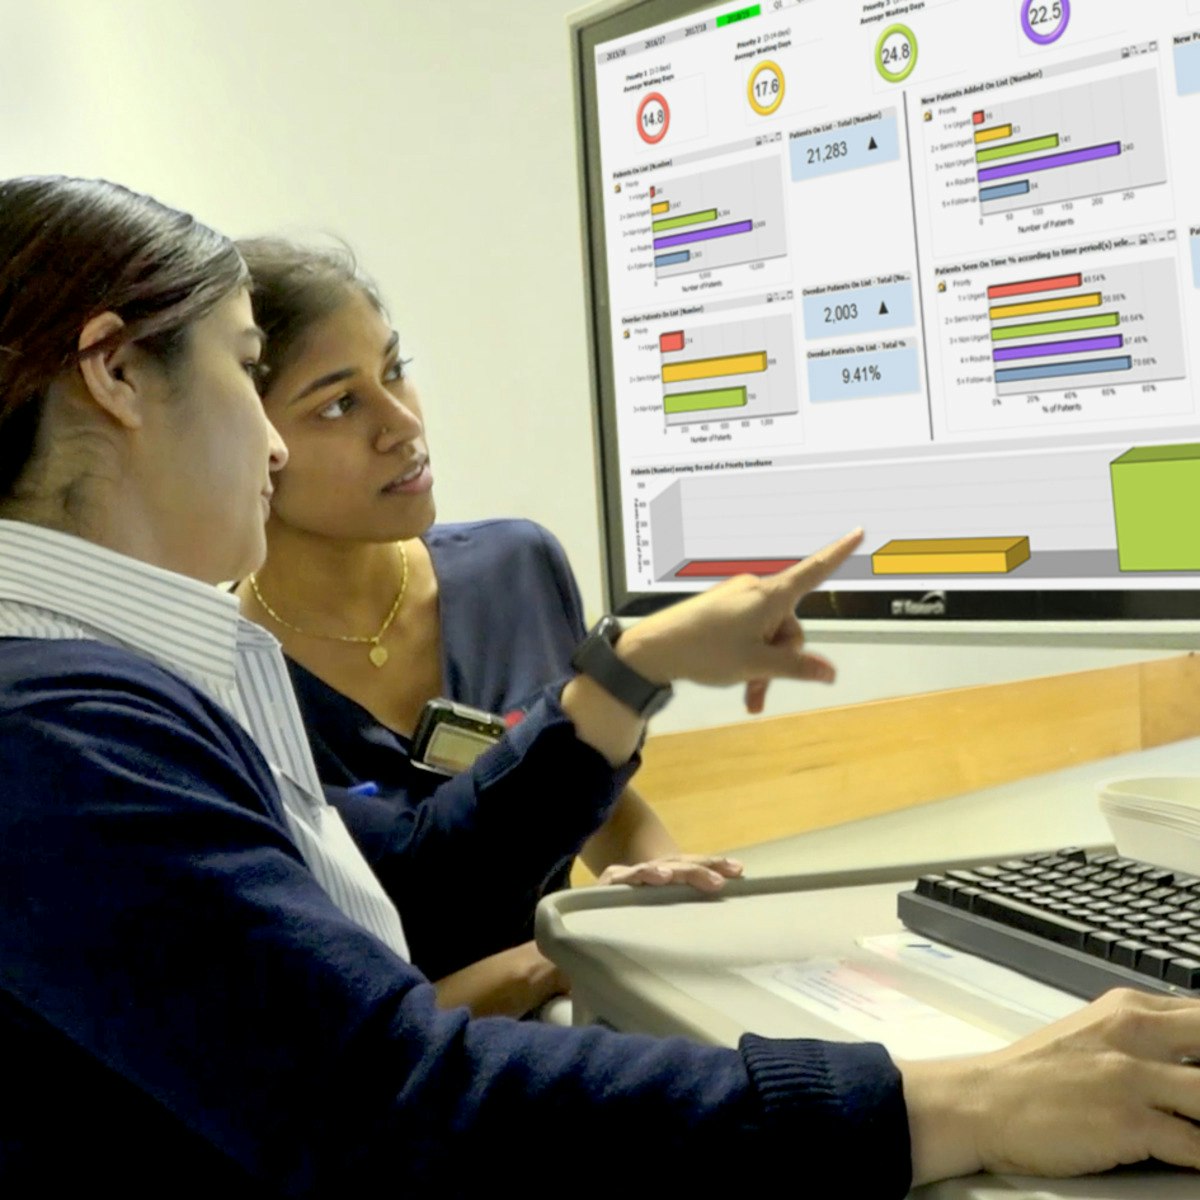
Using clinical health data for better healthcare
Digital health is rapidly being realised as the future of healthcare. While this is placing emphasis on the input of quality health data in digital records and systems, the delivery of safe and quality healthcare relies not only on the input of data, but also the ability to access and derive meaning from data to generate evidence, inform decision making and drive better health outcomes.
This course provides insight into the use of healthcare data, including an overview of best practices and the practical realities of obtaining useful information from digital health systems via the understanding of the fundamental concepts of health data analytics.
Learners will understand why data quality is essential in modern healthcare, as they are guided through various stages of the data life cycle, starting with the generation of quality health data, through to discovering patterns and extracting knowledge from health data using common methodologies and tools in the basic analysis, visualisation and communication of health data. In doing so, learners explore current healthcare delivery contexts, and future and emerging digital health data systems and applications that are rapidly becoming tomorrow’s reality.
On completion of this course, you will be able to:
1. Identify digital health technologies, health data sources, and the evolving roles of health workforce in digital health environments
2. Understand key health data concepts and terminology, including the significance of data integrity and stakeholder roles in the data life cycle
3. Use health data and basic data analysis to inform and improve decision making and practice.
4. Apply effective methods of communication of health data to facilitate safe and quality care.
During this course, you will interact with learning content contributed by:
• Digital Health Cooperative Research Centre
• Australian Digital Health Agency
• eHealth NSW
• Sydney Local Health District
• The NSW Ministry of Health
• Health Education and Training Institute
• Clinical Excellence Commission
• Chris O’Brien Lifehouse
• Monash Partners / Australian Health Research Alliance
• Australian Research Data Commons
• Justice Health & Forensic Mental Health Network
• South Eastern Sydney Local Health District
• Western Sydney Local Health District
• Westmead Breast Cancer Institute
• Agency for Clinical Innovation
• Western NSW Local Health District
• Sydney Children’s Hospital Network
This course is a collaborative venture between NSW Health, the University of Sydney and the Digital Health Cooperative Research Centre, including dedicated resources from eHealth NSW, Health Education and Training Institute, and the Research in Implementation Science & eHealth group. While many learning resources and case examples are drawn from the NSW Health service context, this course has relevance for all existing and future health workforce, regardless of role or work context.
Note: Materials used are for learning purposes and content may not reflect your organisation’s policies. When working with data, make sure you act within the guidelines and policies of your organisation.
Causal Inference 2
This course offers a rigorous mathematical survey of advanced topics in causal inference at the Master’s level.
Inferences about causation are of great importance in science, medicine, policy, and business. This course provides an introduction to the statistical literature on causal inference that has emerged in the last 35-40 years and that has revolutionized the way in which statisticians and applied researchers in many disciplines use data to make inferences about causal relationships.
We will study advanced topics in causal inference, including mediation, principal stratification, longitudinal causal inference, regression discontinuity, interference, and fixed effects models.
Image Segmentation, Filtering, and Region Analysis
In this course, you will build on the skills learned in Introduction to Image Processing to work through common complications such as noise. You’ll use spatial filters to deal with different types of artifacts. You’ll learn new approaches to segmentation such as edge detection and clustering. You’ll also analyze regions of interest and calculate properties such as size, orientation, and location.
By the end of this course, you’ll be able to separate and analyze regions in your own images. You’ll apply your skills to segment an MRI image of a brain to separate different tissues.
You will use MATLAB throughout this course. MATLAB is the go-to choice for millions of people working in engineering and science, and provides the capabilities you need to accomplish your image processing tasks. You will be provided with free access to MATLAB for the duration of the course to complete your work.
To be successful in this course you should have a background in basic math and some exposure to MATLAB. If you want to familiarize yourself with MATLAB check out the free, two-hour MATLAB Onramp. Experience with image processing is not required.
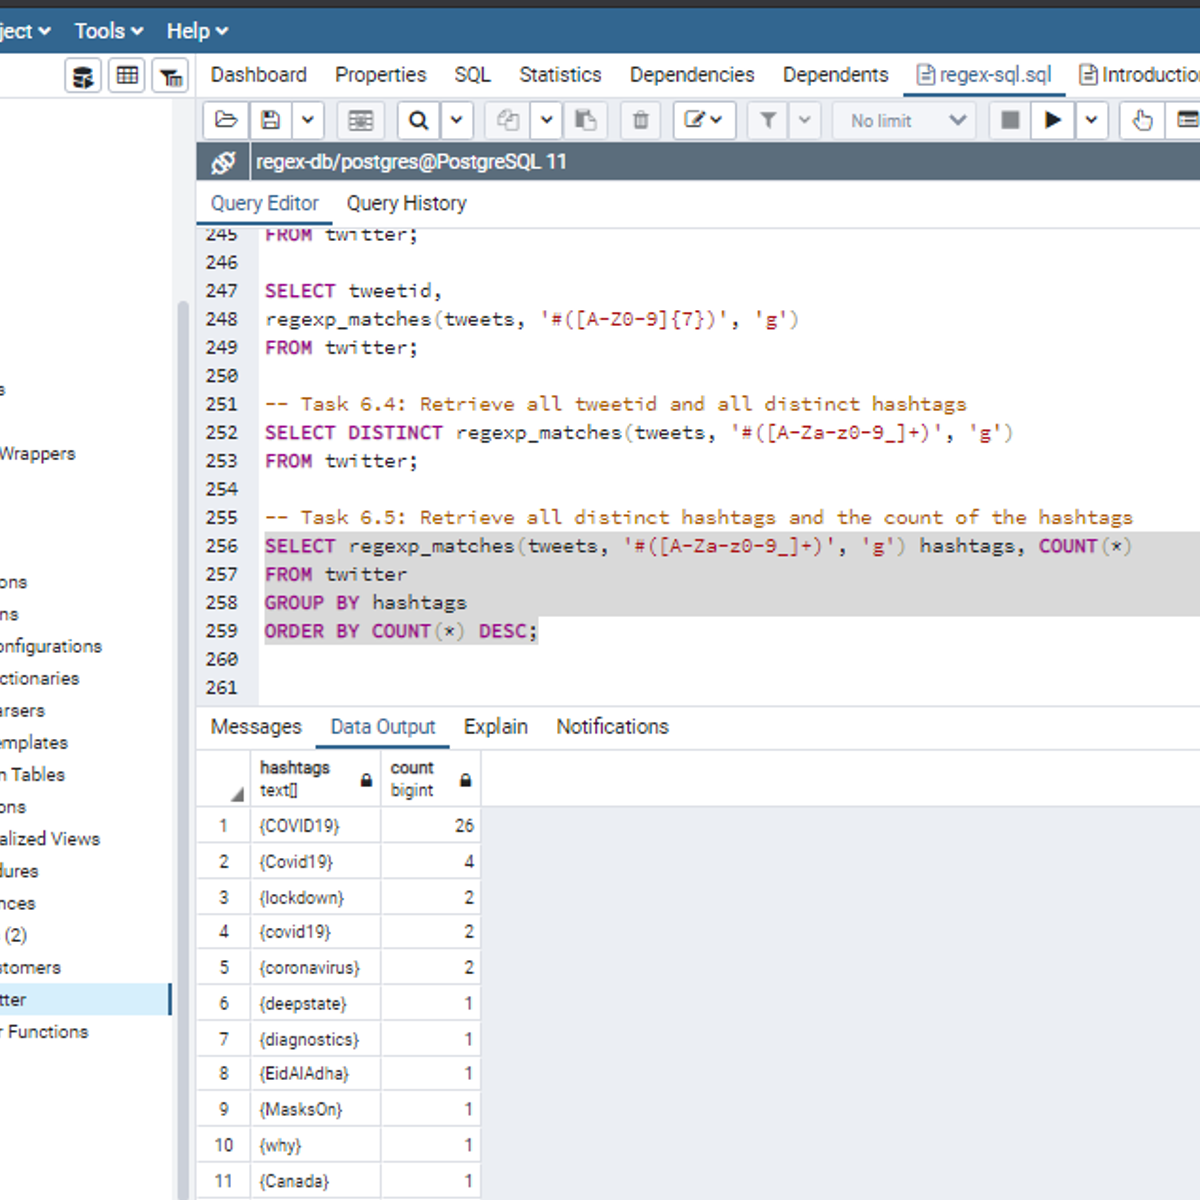
Introduction to Regular Expressions in SQL
Welcome to this project-based course, Introduction to Regular Expressions in SQL. In this project, you will learn how to use SQL regular expressions extensively for pattern matching to query tables in a database.
By the end of this 2-and-a-half-hour-long project, you will be able to use POSIX regular expressions together with meta (special) characters in the WHERE clause and the SELECT clause to retrieve the desired result from a database. In this project, we will move systematically by first revising the use of the LIKE and NOT LIKE operators in the WHERE clause. Then, we will use different regular expression metacharacters together with POSIX operators in the WHERE clause. Also, we will use regular expressions to work on tweets from Twitter data. Be assured that you will get your hands really dirty in this project because you will get to work on a lot of exercises to reinforce your knowledge of the concepts.
Also, for this hands-on project, we will use PostgreSQL as our preferred database management system (DBMS). Therefore, to complete this project, it is required that you have prior experience with using PostgreSQL. Similarly, this project is an intermediate SQL concept; so, a good foundation for writing SQL queries is vital to complete this project.
If you are not familiar with writing queries in SQL and want to learn these concepts, start with my previous guided projects titled “Querying Databases using SQL SELECT statement." I taught this guided project using PostgreSQL. So, taking these projects will give the needed requisite to complete this Introduction to Regular Expressions in SQL project. However, if you are comfortable writing queries in PostgreSQL, please join me on this wonderful ride! Let’s get our hands dirty!
Popular Internships and Jobs by Categories
Find Jobs & Internships
Browse


© 2024 BoostGrad | All rights reserved