
Back to Courses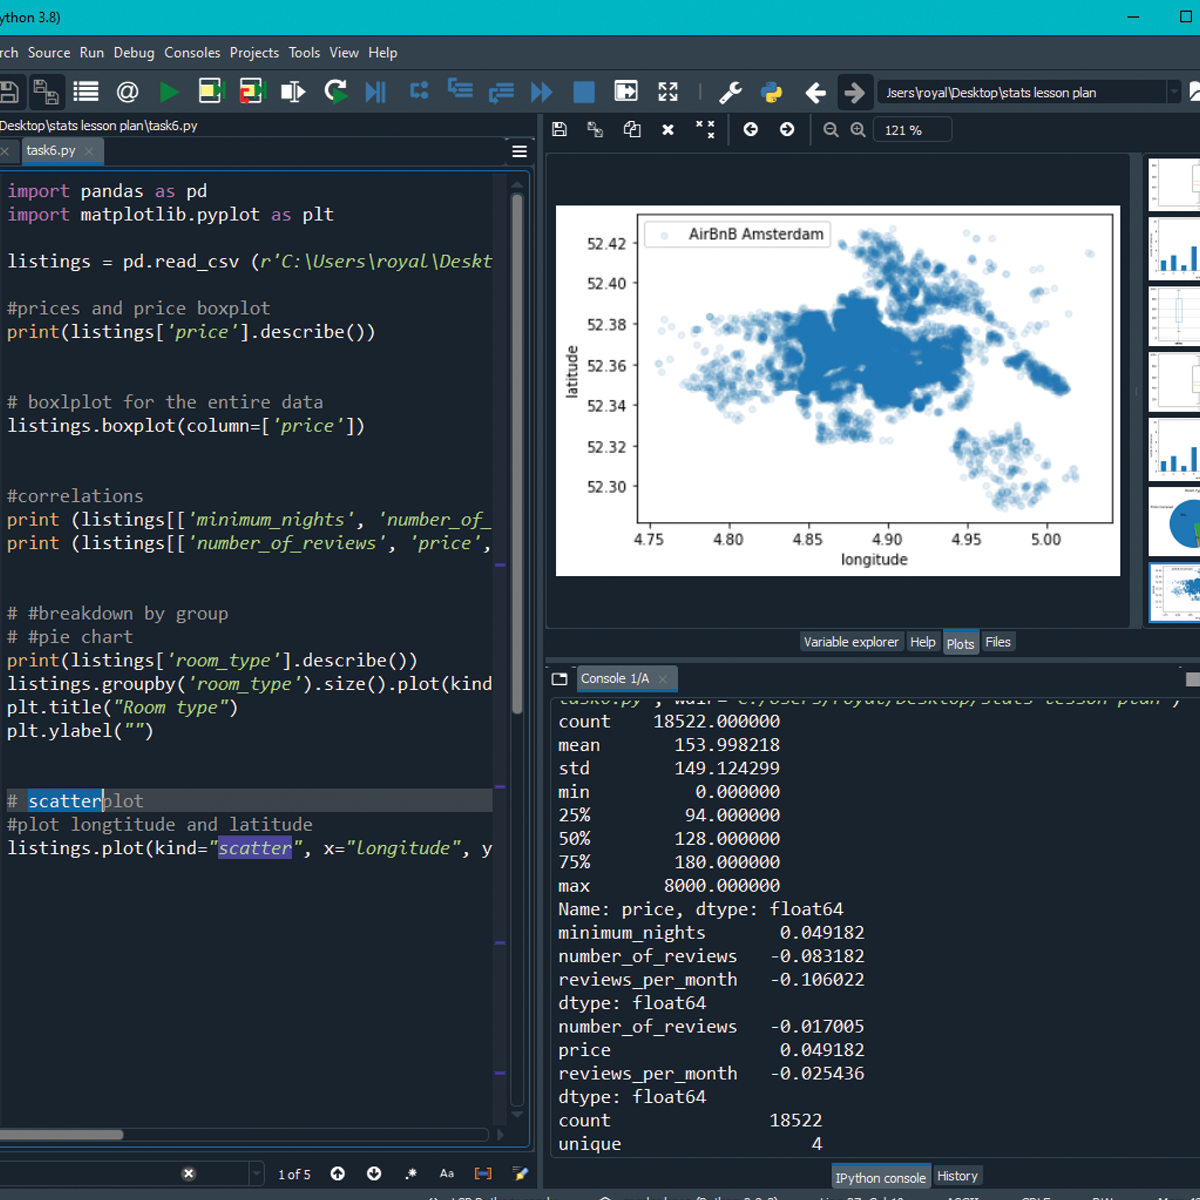


Data Science Courses - Page 132
Showing results 1311-1320 of 1407
Introduction to Statistics in Python
In this project, learners will get a refresher of introductory statistics, learn about different python libraries that can be used to run statistical analysis, and create visualizations to represent the results. By the end of the project, the learners will import a real world data set, run statistical analysis to find means, medians , standard deviations, correlations, and other information of the data. The learners will also create distinct graphs and plots to represent the data.
Along the way, the learners will not only learn the frequently used statistics functions, but also learn to navigate documentations for different python libraries in order to find assistance in the implementation of those functions, and find other relevant functions as well. This will help the learners to understand the material and implement more complex functions down the road instead of simply memorizing the syntax of one solution.
Note: This course works best for learners who are based in the North America region. We’re currently working on providing the same experience in other regions.
Foundations of strategic business analytics
Who is this course for?
This course is designed for students, business analysts, and data scientists who want to apply statistical knowledge and techniques to business contexts. For example, it may be suited to experienced statisticians, analysts, engineers who want to move more into a business role.
You will find this course exciting and rewarding if you already have a background in statistics, can use R or another programming language and are familiar with databases and data analysis techniques such as regression, classification, and clustering.
However, it contains a number of recitals and R Studio tutorials which will consolidate your competences, enable you to play more freely with data and explore new features and statistical functions in R.
With this course, you’ll have a first overview on Strategic Business Analytics topics. We’ll discuss a wide variety of applications of Business Analytics. From Marketing to Supply Chain or Credit Scoring and HR Analytics, etc. We’ll cover many different data analytics techniques, each time explaining how to be relevant for your business.
We’ll pay special attention to how you can produce convincing, actionable, and efficient insights. We'll also present you with different data analytics tools to be applied to different types of issues.
By doing so, we’ll help you develop four sets of skills needed to leverage value from data: Analytics, IT, Business and Communication.
By the end of this MOOC, you should be able to approach a business issue using Analytics by (1) qualifying the issue at hand in quantitative terms, (2) conducting relevant data analyses, and (3) presenting your conclusions and recommendations in a business-oriented, actionable and efficient way.
Prerequisites : 1/ Be able to use R or to program 2/ To know the fundamentals of databases, data analysis (regression, classification, clustering)
We give credit to Pauline Glikman, Albane Gaubert, Elias Abou Khalil-Lanvin (Students at ESSEC BUSINESS SCHOOL) for their contribution to this course design.
Deploy an NLP Text Generator: Bart Simpson Chalkboard Gag
Welcome to the “Deploy an NLP Text Generator: Bart Simpson Chalkboard Gag” guided project.
Text Generation is a natural language technique that leverages language modeling to create or predict new text based on texts it has been trained on. An example of text generation can be identified in the Gmail sentence autocomplete feature.
In this project, we will deploy an NLP text generator model as a python Streamlit app. The model, which has been trained on all the text from Bart Simpsons chalkboard gag from the Simpsons, will be able to autogenerate new chalkboard gags.
This project is an intermediate python project for anyone interested in learning about how to productionize natural language text generator models as a Streamlit app on Heroku. It requires preliminary knowledge on how to build and train NLP text generator models (as we will not be building or training models) and how to utilize Git. Learners would also need a Heroku account and some familiarity with the Python Streamlit module.
At the end of this project, learners will have a publicly available Streamlit web app that leverages natural language processing text generation to generate new text for Bart Simpsons' chalkboard gags.
Getting and Cleaning Data
Before you can work with data you have to get some. This course will cover the basic ways that data can be obtained. The course will cover obtaining data from the web, from APIs, from databases and from colleagues in various formats. It will also cover the basics of data cleaning and how to make data “tidy”. Tidy data dramatically speed downstream data analysis tasks. The course will also cover the components of a complete data set including raw data, processing instructions, codebooks, and processed data. The course will cover the basics needed for collecting, cleaning, and sharing data.
Datastore: Qwik Start
This is a self-paced lab that takes place in the Google Cloud console.
This hands-on lab will show you how to store and query data in Google Cloud Datastore using the Google Cloud Platform.
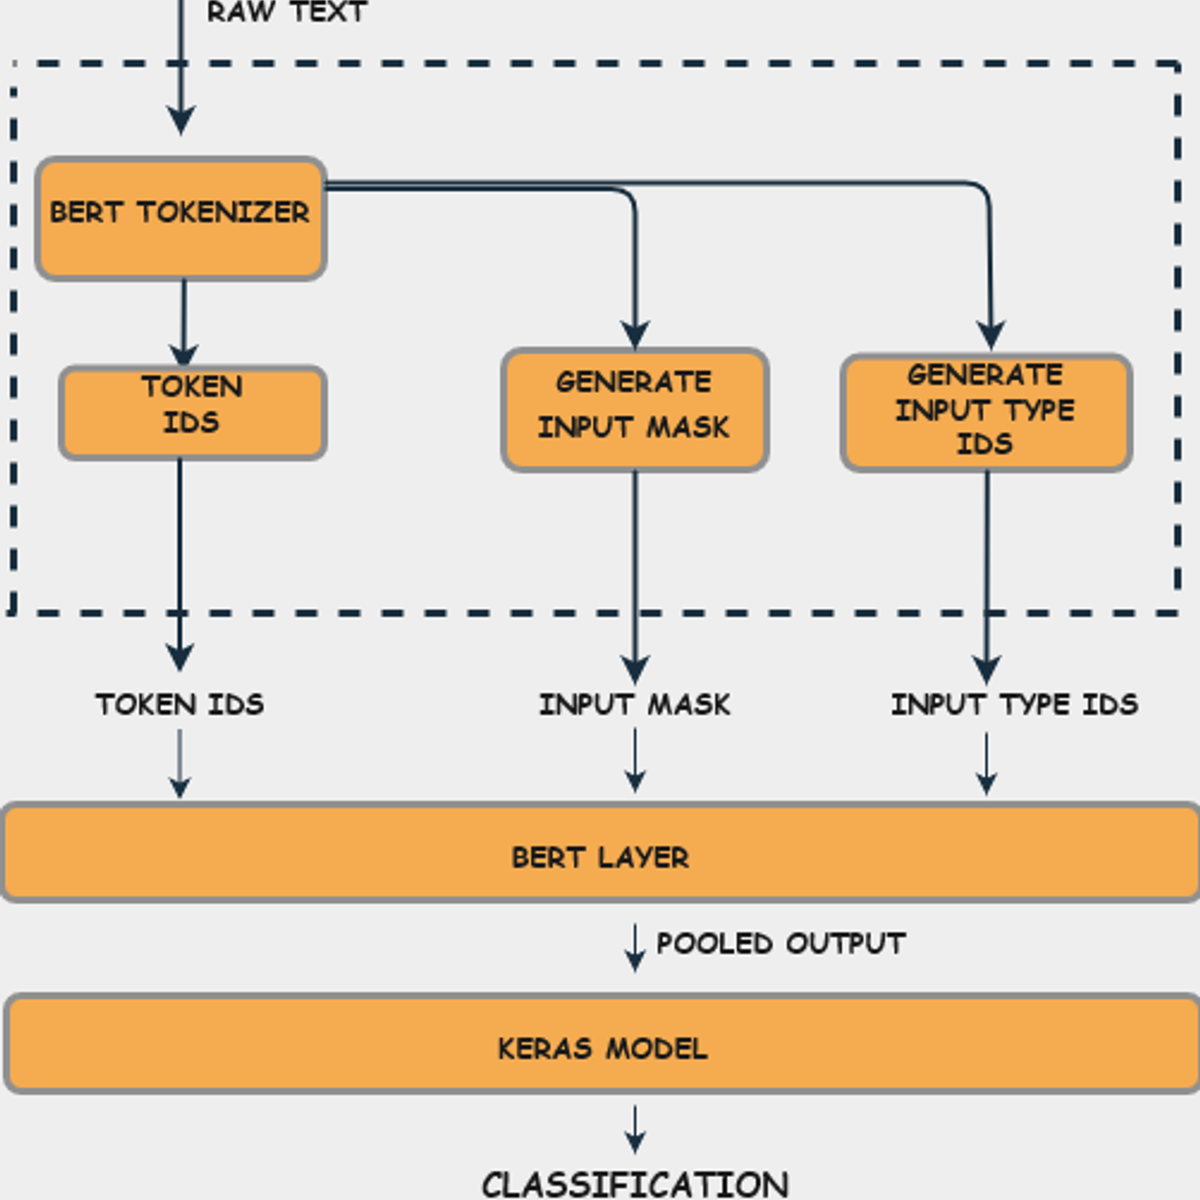
Fine Tune BERT for Text Classification with TensorFlow
This is a guided project on fine-tuning a Bidirectional Transformers for Language Understanding (BERT) model for text classification with TensorFlow. In this 2.5 hour long project, you will learn to preprocess and tokenize data for BERT classification, build TensorFlow input pipelines for text data with the tf.data API, and train and evaluate a fine-tuned BERT model for text classification with TensorFlow 2 and TensorFlow Hub.
Prerequisites:
In order to successfully complete this project, you should be competent in the Python programming language, be familiar with deep learning for Natural Language Processing (NLP), and have trained models with TensorFlow or and its Keras API.
Note: This course works best for learners who are based in the North America region. We’re currently working on providing the same experience in other regions.
Forensic Accounting and Fraud Examination
Everyday across the world, thousands of businesses are victimized by fraud. Who commits these bad acts? Why? And, how? In this course we are going to help you answer the questions: who commits fraud, why and how. We’ll also help you develop skills for catching them.
Plots Creation using Matplotlib Python
By the end of this project, you will be able to add the data in the CSV file to Pandas data frame, plot the graph, and set marker type and color. You will also be able to apply labels, change font size, add grid lines and legends. Finally, you will be able to create the boxplot and save the graph as an image using the matplotlib and seaborn libraries, which are the most important libraries in python that are used for Data Visualization. You can create bar-plots, scatter-plots, histograms, and a lot more with them.
This guided project is for people in the field of data and data analysis. people who want to learn python and Pandas library. It provides you with the important steps to be a data analyst. Moreover, it equips you with the knowledge of python's native data structures
Optimizing Performance of LookML Queries
This is a Google Cloud Self-Paced Lab. In this lab, you'll learn the best methods to optimize query performance in Looker.
Looker is a modern data platform in Google Cloud that you can use to analyze and visualize your data interactively. You can use Looker to do in-depth data analysis, integrate insights across different data sources, build actionable data-driven workflows, and create custom data applications.
Big, complex queries can be costly, and running them repeatedly strains your database, thereby reducing performance. Ideally, you want to avoid re-running massive queries if nothing has changed, and instead, append new data to existing results to reduce repetitive requests. Although there are many ways to optimize performance of LookML queries, this lab focuses on the most commonly used methods to optimize query performance in Looker: persistent derived tables, aggregate awareness, and performantly joining views.
Introduction to Trading, Machine Learning & GCP
In this course, you’ll learn about the fundamentals of trading, including the concept of trend, returns, stop-loss, and volatility. You will learn how to identify the profit source and structure of basic quantitative trading strategies. This course will help you gauge how well the model generalizes its learning, explain the differences between regression and forecasting, and identify the steps needed to create development and implementation backtesters. By the end of the course, you will be able to use Google Cloud Platform to build basic machine learning models in Jupyter Notebooks.
To be successful in this course, you should have advanced competency in Python programming and familiarity with pertinent libraries for machine learning, such as Scikit-Learn, StatsModels, and Pandas. Experience with SQL is recommended. You should have a background in statistics (expected values and standard deviation, Gaussian distributions, higher moments, probability, linear regressions) and foundational knowledge of financial markets (equities, bonds, derivatives, market structure, hedging).