
Back to Courses


Data Science Courses - Page 131
Showing results 1301-1310 of 1407
Getting Started in Google Analytics
In this project, you will learn how to connect your website to Google Analytics. You will be able to use Google Analytics to understand how your website is performing. You will become familiar with the Google Analytics interface and the standard reports to better understand your website audience. You will learn how to interpret this data to improve your website performance and effectiveness.
Note: This course works best for learners who are based in the North America region. We’re currently working on providing the same experience in other regions.
Data Visualization and Dashboards with Excel and Cognos
This course covers some of the first steps in the development of data visualizations using spreadsheets and dashboards. Begin the process of telling a story with your data by creating the many types of charts that are available in spreadsheets like Excel. Explore the different tools of a spreadsheet, such as the important pivot function and the ability to create dashboards and learn how each one has its own unique property to transform your data. Continue to gain valuable experience by becoming familiar with the popular analytics tool - IBM Cognos Analytics - to create interactive dashboards.
By completing this course, you will have a basic understanding of using spreadsheets as a data visualization tool. You will gain the ability to effectively create data visualizations, such as charts or graphs, and will begin to see how they play a key role in communicating your data analysis findings. All of this can be accomplished by learning the basics of data analysis with Excel and IBM Cognos Analytics, without having to write any code. By the end of this course you will be able to describe common dashboarding tools used by a data analyst, design and create a dashboard in a cloud platform, and begin to elevate your confidence level in creating intermediate level data visualizations.
Throughout this course you will encounter numerous hands-on labs and a final project. With each lab, gain hands-on experience with creating basic and advanced charts, then continue through the course and begin creating dashboards with spreadsheets and IBM Cognos Analytics. You will then end this course by creating a set of data visualizations with IBM Cognos Analytics and creating an interactive dashboard that can be shared with peers, professional communities or prospective employers.
This course does not require any prior data analysis, or computer science experience. All you need to get started is basic computer literacy, high school level math, access to a modern web browser such as Chrome or Firefox, the ability to create a Microsoft account to access Excel for the Web, and a basic understanding of Excel spreadsheets.
Hands-on Machine Learning with AWS and NVIDIA
Machine learning (ML) projects can be complex, tedious, and time consuming. AWS and NVIDIA solve this challenge with fast, effective, and easy-to-use capabilities for your ML project.
This course is designed for ML practitioners, including data scientists and developers, who have a working knowledge of machine learning workflows. In this course, you will gain hands-on experience on building, training, and deploying scalable machine learning models with Amazon SageMaker and Amazon EC2 instances powered by NVIDIA GPUs. Amazon SageMaker helps data scientists and developers prepare, build, train, and deploy high-quality ML models quickly by bringing together a broad set of capabilities purpose-built for ML. Amazon EC2 instances powered by NVIDIA GPUs along with NVIDIA software offer high performance GPU-optimized instances in the cloud for efficient model training and cost effective model inference hosting.
In this course, you will first get an overview of Amazon SageMaker and NVIDIA GPUs. Then, you will get hands-on, by running a GPU powered Amazon SageMaker notebook instance. You will then learn how to prepare a dataset for model training, build a model, execute model training, and deploy and optimize the ML model. You will also learn, hands-on, how to apply this workflow for computer vision (CV) and natural language processing (NLP) use cases. After completing this course, you will be able to build, train, deploy, and optimize ML workflows with GPU acceleration in Amazon SageMaker and understand the key Amazon SageMaker services applicable to computer vision and NLP ML tasks.
Build Image Quality Inspection using AWS Lookout for Vision
In this guided project, you will learn how to build automated image quality inspection using Amazon Lookout for Vision. Amazon Lookout for Vision is a Machine Learning as a Service from Amazon Web services which you could leverage to do Image Analytics and address interesting use cases such as drone detection, defect detection, object detection, smile detection, fall detection without writing a single line of code.
Please note: As part of this course, you would need your AWS Account to complete the course. It would be charged as per your usage of AWS Lookout for Vision service.
Introduction to Microsoft Excel
At the end of this project, you will be able to start a simple spreadsheet in Microsoft Excel. Being able to use Microsoft Excel will allow you to simplify many of your daily tasks at work but also at home. There is no limit to what you can use Microsoft Excel for, you can use it to plan the annual budget of your business, you can use it to track business expenses but you can also use it simply to keep inventory of all the books you own.
Customer Analytics
Data about our browsing and buying patterns are everywhere. From credit card transactions and online shopping carts, to customer loyalty programs and user-generated ratings/reviews, there is a staggering amount of data that can be used to describe our past buying behaviors, predict future ones, and prescribe new ways to influence future purchasing decisions. In this course, four of Wharton’s top marketing professors will provide an overview of key areas of customer analytics: descriptive analytics, predictive analytics, prescriptive analytics, and their application to real-world business practices including Amazon, Google, and Starbucks to name a few. This course provides an overview of the field of analytics so that you can make informed business decisions. It is an introduction to the theory of customer analytics, and is not intended to prepare learners to perform customer analytics.
Course Learning Outcomes:
After completing the course learners will be able to...
Describe the major methods of customer data collection used by companies and understand how this data can inform business decisions
Describe the main tools used to predict customer behavior and identify the appropriate uses for each tool
Communicate key ideas about customer analytics and how the field informs business decisions
Communicate the history of customer analytics and latest best practices at top firms
TensorFlow for AI: Applying Image Convolution
This guided project course is part of the "Tensorflow for AI" series, and this series presents material that builds on the first course of DeepLearning.AI TensorFlow Developer Professional Certificate, which will help learners reinforce their skills and build more projects with Tensorflow.
In this 1.5-hour long project-based course, you will discover convolutions, apply filters to images, apply pooling layers, and try out the convolution and pooling techniques on real images to learn about how convolutions work. At the end of the project, you will get a bonus deep learning project implemented with Tensorflow. By the end of this project, you will have learned how convolutions work and how to create convolutional layers to prepare for your own deep learning projects using convolutional neural networks.
This class is for learners who want to use Python for building convolutional neural networks with TensorFlow, and for learners who are currently taking a basic deep learning course or have already finished a deep learning course and are searching for a knowledge-based course about convolutions in images with TensorFlow. Also, this project provides learners with needed knowledge about building convolutional neural networks and improves their skills in applying filters to images which helps them in fulfilling their career goals by adding this project to their portfolios.
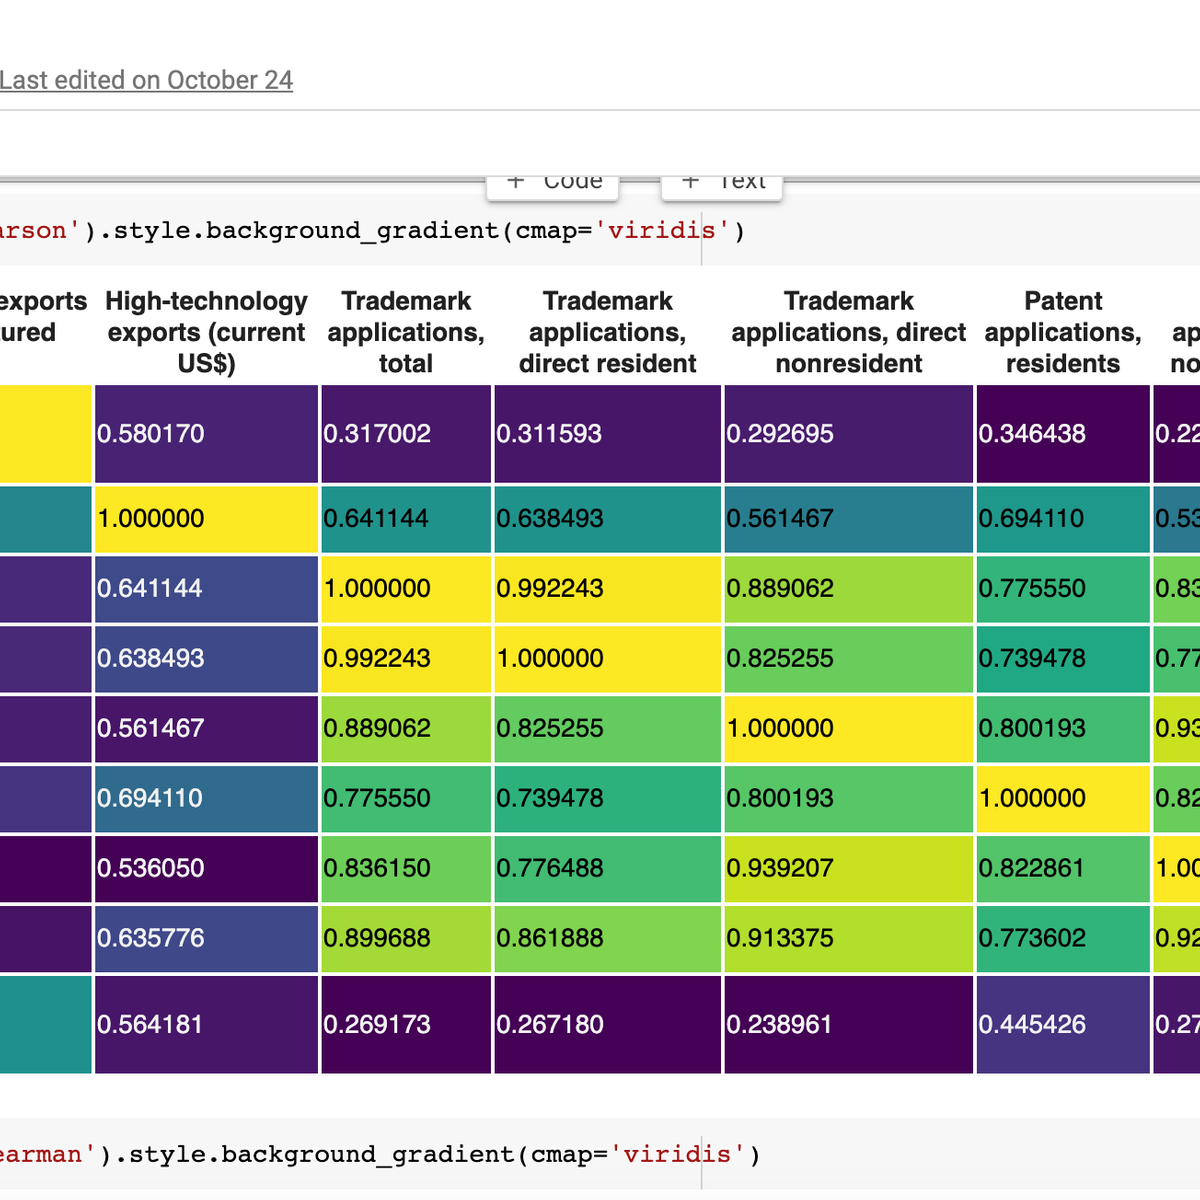
Basic Statistics in Python (Correlations and T-tests)
By the end of this project, you will learn how to use Python for basic statistics (including t-tests and correlations). We will learn all the important steps of analysis, including loading, sorting and cleaning data. In this course, we will use exploratory data analysis to understand our data and plot boxplots to visualize the data. Boxplots also allow us to investigate any outliers in our datasets. We will then learn how to examine relationships between the different data using correlations and scatter plots. Finally, we will compare data using t-tests. Throughout this course we will analyse a dataset on Science and Technology from World Bank. The measures in this dataset are numeric, therefore you will learn how to handle and compare numeric data.
This guided project is for anyone with an interest in performing statistical analysis using Python. This could be someone from a social science background with statistics knowledge who wants to advance their analysis, or anyone interested in analysing data.
Overview of Connected Planning
Connected Planning is a technology-enabled approach to business planning that transforms the way organizations use their data, people, and plans. Decision makers, and ultimately the entire organization, plan and pivot with confidence when faced with changes, whether in an organization, the marketplace, or even the global economy.
From this Introduction to Connected Planning, you’ll understand its history in business modeling and scenario planning, the trends that make it essential to business success today, and the measurable impact that Connected Planning has had on organizations.
By the end of this course, you’ll be able to:
• Describe the key characteristics of Connected Planning
• Understand the history of Connected Planning and its roots in business modeling and scenario planning
• Explain why current events and trends are leading many organizations to adopt Connected Planning
• Articulate the benefits of Connected Planning
This course is presented by Anaplan, provider of a leading technology platform that is purpose-built for Connected Planning.
Fundamentals of Quantitative Modeling
How can you put data to work for you? Specifically, how can numbers in a spreadsheet tell us about present and past business activities, and how can we use them to forecast the future? The answer is in building quantitative models, and this course is designed to help you understand the fundamentals of this critical, foundational, business skill. Through a series of short lectures, demonstrations, and assignments, you’ll learn the key ideas and process of quantitative modeling so that you can begin to create your own models for your own business or enterprise. By the end of this course, you will have seen a variety of practical commonly used quantitative models as well as the building blocks that will allow you to start structuring your own models. These building blocks will be put to use in the other courses in this Specialization.