
Back to Courses


Data Science Courses - Page 110
Showing results 1091-1100 of 1407
Mining Quality Prediction Using Machine & Deep Learning
In this 1.5-hour long project-based course, you will be able to:
- Understand the theory and intuition behind Simple and Multiple Linear Regression.
- Import Key python libraries, datasets and perform data visualization
- Perform exploratory data analysis and standardize the training and testing data.
- Train and Evaluate different regression models using Sci-kit Learn library.
- Build and train an Artificial Neural Network to perform regression.
- Understand the difference between various regression models KPIs such as MSE, RMSE, MAE, R2, and adjusted R2.
- Assess the performance of regression models and visualize the performance of the best model using various KPIs.
Data-driven Decision Making
Welcome to Data-driven Decision Making. In this course, you'll get an introduction to Data Analytics and its role in business decisions. You'll learn why data is important and how it has evolved. You'll be introduced to “Big Data” and how it is used. You'll also be introduced to a framework for conducting Data Analysis and what tools and techniques are commonly used. Finally, you'll have a chance to put your knowledge to work in a simulated business setting.
This course was created by PricewaterhouseCoopers LLP with an address at 300 Madison Avenue, New York, New York, 10017.
Computer Simulations
Big data and artificial intelligence get most of the press about computational social science, but maybe the most complex aspect of it refers to using computational tools to explore and develop social science theory. This course shows how computer simulations are being used to explore the realm of what is theoretically possible. Computer simulations allow us to study why societies are the way they are, and to dream about the world we would like to live in. This can be as intuitive as playing a video game. Much like the well-known video game SimCity is used to build and manage an artificial city, we use agent-based models to grow and study artificial societies. Without hurting anyone in the real world, computer simulations allow us explore how to make the world a better place. We play hands-on with several practical computer simulation models and explore how we can combine hypothetical models with real world data. Finally, you will program a simple artificial society yourself, bottom-up. This will allow you to feel the complexity that arises when designing social systems, while at the same time experiencing the ease with which our new computational tools allow us to pursue such daunting endeavors.
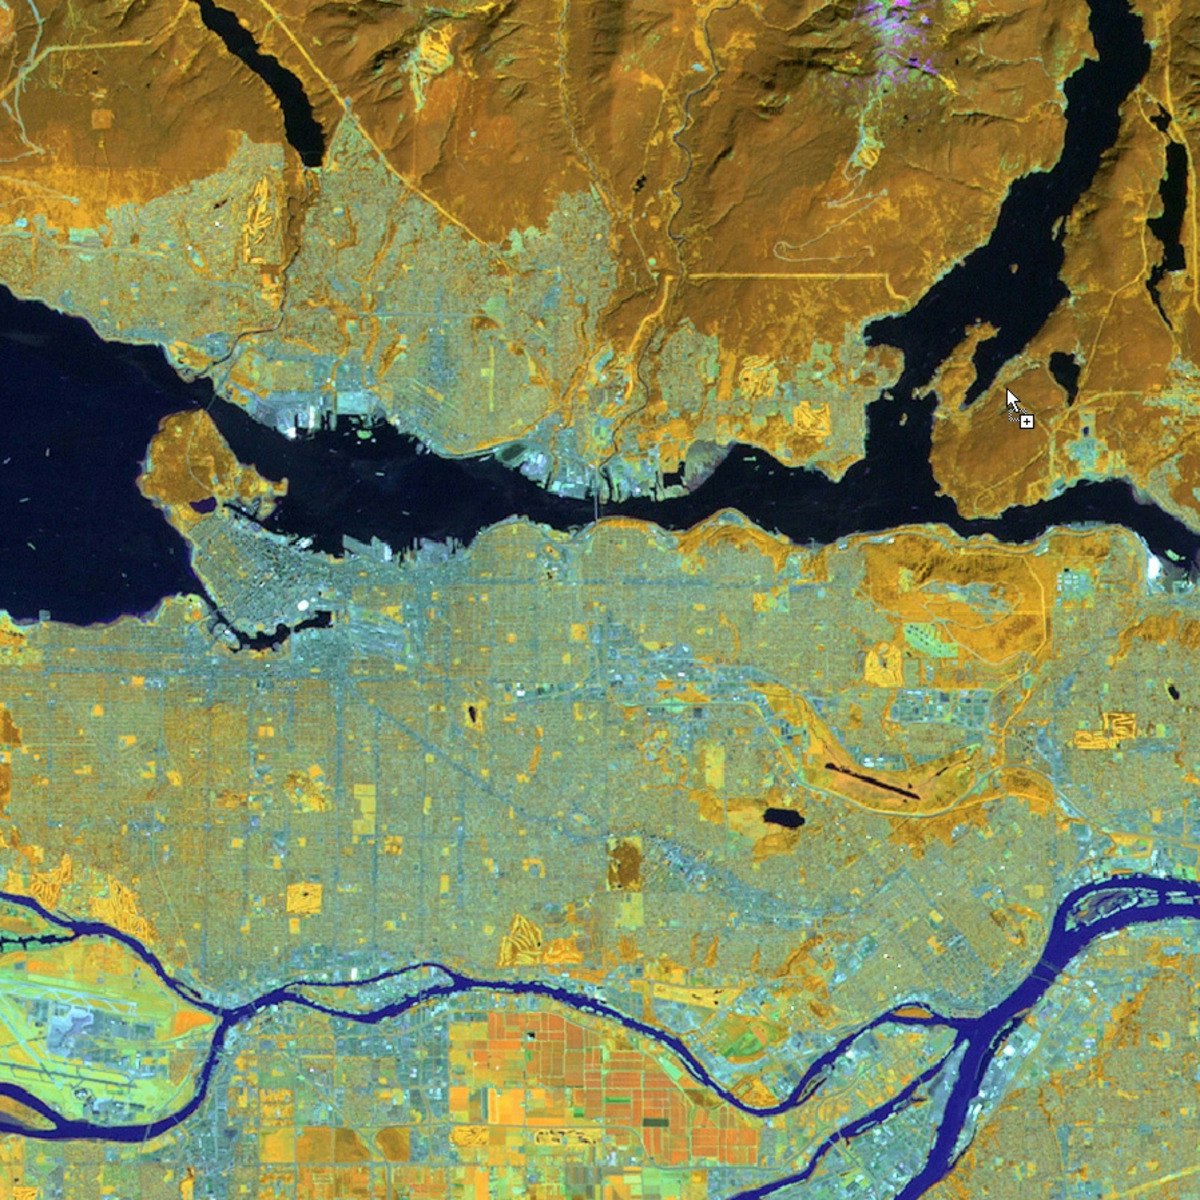
Spatial Analysis and Satellite Imagery in a GIS
In this course, you will learn how to analyze map data using different data types and methods to answer geographic questions. First, you will learn how to filter a data set using different types of queries to find just the data you need to answer a particular question. Then, we will discuss simple yet powerful analysis methods that use vector data to find spatial relationships within and between data sets. In this section, you will also learn about how to use ModelBuilder, a simple but powerful tool for building analysis flowcharts that can then also be run as models. You will then learn how to find, understand, and use remotely sensed data such as satellite imagery, as a rich source of GIS data. You will then learn how to analyze raster data. Finally, you will complete your own project where you get to try out the new skills and tools you have learned about in this course.
Note: software is not provided for this course.
Create Beautiful Data Visualizations with Python and Altair
In this Project, we would be creating some visualizations with Altair Python library and you will learn how to manipulate, interact with and save those charts.
Artificial Intelligence for Breast Cancer Detection
The objective of this course is to provide students the knowledge of artificial intelligence processing approaches to breast cancer detection. Students will take quizzes and participate in discussion sessions to reinforce critical concepts conveyed in the modules. Reading assignments, including journal papers to understand the topics in the modules, will be provided.
The course is designed for students who are interested in the career of product development using artificial intelligence and would like to know how AI can be applied to mammography. The course content is focused on the AI processing paradigm along with the domain knowledge of breast imaging.
This course approach is unique, providing students a broad perspective of AI, rather than homing in on a particular implementation method. Students who complete this course will not only leverage the knowledge into an entry level job in the field of artificial intelligence but also perform well on projects because their thorough understanding of the AI processing paradigm.
Python for Data Science, AI & Development
Kickstart your learning of Python for data science, as well as programming in general, with this beginner-friendly introduction to Python. Python is one of the world’s most popular programming languages, and there has never been greater demand for professionals with the ability to apply Python fundamentals to drive business solutions across industries.
This course will take you from zero to programming in Python in a matter of hours—no prior programming experience necessary! You will learn Python fundamentals, including data structures and data analysis, complete hands-on exercises throughout the course modules, and create a final project to demonstrate your new skills.
By the end of this course, you’ll feel comfortable creating basic programs, working with data, and solving real-world problems in Python. You’ll gain a strong foundation for more advanced learning in the field, and develop skills to help advance your career.
This course can be applied to multiple Specialization or Professional Certificate programs. Completing this course will count towards your learning in any of the following programs:
IBM Applied AI Professional Certificate
Applied Data Science Specialization
IBM Data Science Professional Certificate
Upon completion of any of the above programs, in addition to earning a Specialization completion certificate from Coursera, you’ll also receive a digital badge from IBM recognizing your expertise in the field.
Data Science as a Field
This course provides a general introduction to the field of Data Science. It has been designed for aspiring data scientists, content experts who work with data scientists, or anyone interested in learning about what Data Science is and what it’s used for. Weekly topics include an overview of the skills needed to be a data scientist; the process and pitfalls involved in data science; and the practice of data science in the professional and academic world. This course is part of CU Boulder’s Master’s of Science in Data Science and was collaboratively designed by both academics and industry professionals to provide learners with an insider’s perspective on this exciting, evolving, and increasingly vital discipline.
Data Science as a Field can be taken for academic credit as part of CU Boulder’s Master of Science in Data Science (MS-DS) degree offered on the Coursera platform. The MS-DS is an interdisciplinary degree that brings together faculty from CU Boulder’s departments of Applied Mathematics, Computer Science, Information Science, and others. With performance-based admissions and no application process, the MS-DS is ideal for individuals with a broad range of undergraduate education and/or professional experience in computer science, information science, mathematics, and statistics. Learn more about the MS-DS program at https://www.coursera.org/degrees/master-of-science-data-science-boulder.
Microsoft Azure Databricks for Data Engineering
In this course, you will learn how to harness the power of Apache Spark and powerful clusters running on the Azure Databricks platform to run large data engineering workloads in the cloud.
You will discover the capabilities of Azure Databricks and the Apache Spark notebook for processing huge files. You will come to understand the Azure Databricks platform and identify the types of tasks well-suited for Apache Spark. You will also be introduced to the architecture of an Azure Databricks Spark Cluster and Spark Jobs. You will work with large amounts of data from multiple sources in different raw formats. you will learn how Azure Databricks supports day-to-day data-handling functions, such as reads, writes, and queries.
This course is part of a Specialization intended for Data engineers and developers who want to demonstrate their expertise in designing and implementing data solutions that use Microsoft Azure data services for anyone interested in preparing for the Exam DP-203: Data Engineering on Microsoft Azure (beta). You will take a practice exam that covers key skills measured by the certification exam.
This is the eighth course in a program of 10 courses to help prepare you to take the exam so that you can have expertise in designing and implementing data solutions that use Microsoft Azure data services. The Data Engineering on Microsoft Azure exam is an opportunity to prove knowledge expertise in integrating, transforming, and consolidating data from various structured and unstructured data systems into structures that are suitable for building analytics solutions that use Microsoft Azure data services. Each course teaches you the concepts and skills that are measured by the exam.
By the end of this Specialization, you will be ready to take and sign-up for the Exam DP-203: Data Engineering on Microsoft Azure (beta).
Analyze Website Visitors with Google Analytics Segments
In this project you will learn how to use segments in Google Analytics and how they provide a deeper analysis of your website visitors. You will learn how to set up and use segments. You will learn about system segments and custom segments. You will also learn how to import segments. You will understand how using segments helps you make better decisions when it comes to increasing and converting your website traffic.
Note: This course works best for learners who are based in the North America region. We’re currently working on providing the same experience in other regions.
Popular Internships and Jobs by Categories
Browse
© 2024 BoostGrad | All rights reserved