
Back to Courses


Data Science Courses - Page 107
Showing results 1061-1070 of 1407
Introduction to Portfolio Construction and Analysis with Python
The practice of investment management has been transformed in recent years by computational methods. This course provides an introduction to the underlying science, with the aim of giving you a thorough understanding of that scientific basis. However, instead of merely explaining the science, we help you build on that foundation in a practical manner, with an emphasis on the hands-on implementation of those ideas in the Python programming language.
This course is the first in a four course specialization in Data Science and Machine Learning in Asset Management but can be taken independently. In this course, we cover the basics of Investment Science, and we'll build practical implementations of each of the concepts along the way. We'll start with the very basics of risk and return and quickly progress to cover a range of topics including several Nobel Prize winning concepts. We'll cover some of the most popular practical techniques in modern, state of the art investment management and portfolio construction.
As we cover the theory and math in lecture videos, we'll also implement the concepts in Python, and you'll be able to code along with us so that you have a deep and practical understanding of how those methods work. By the time you are done, not only will you have a foundational understanding of modern computational methods in investment management, you'll have practical mastery in the implementation of those methods.
AI for Medical Diagnosis
AI is transforming the practice of medicine. It’s helping doctors diagnose patients more accurately, make predictions about patients’ future health, and recommend better treatments. As an AI practitioner, you have the opportunity to join in this transformation of modern medicine. If you're already familiar with some of the math and coding behind AI algorithms, and are eager to develop your skills further to tackle challenges in the healthcare industry, then this specialization is for you. No prior medical expertise is required!
This program will give you practical experience in applying cutting-edge machine learning techniques to concrete problems in modern medicine:
- In Course 1, you will create convolutional neural network image classification and segmentation models to make diagnoses of lung and brain disorders.
- In Course 2, you will build risk models and survival estimators for heart disease using statistical methods and a random forest predictor to determine patient prognosis.
- In Course 3, you will build a treatment effect predictor, apply model interpretation techniques and use natural language processing to extract information from radiology reports.
These courses go beyond the foundations of deep learning to give you insight into the nuances of applying AI to medical use cases. As a learner, you will be set up for success in this program if you are already comfortable with some of the math and coding behind AI algorithms. You don't need to be an AI expert, but a working knowledge of deep neural networks, particularly convolutional networks, and proficiency in Python programming at an intermediate level will be essential. If you are relatively new to machine learning or neural networks, we recommend that you first take the Deep Learning Specialization, offered by deeplearning.ai and taught by Andrew Ng.
The demand for AI practitioners with the skills and knowledge to tackle the biggest issues in modern medicine is growing exponentially. Join us in this specialization and begin your journey toward building the future of healthcare.
Advanced Topics and Future Trends in Database Technologies
This course consists of four modules covering some of the more in-depth and advanced areas of database technologies, followed by a look at the future of database software and where the industry is heading.
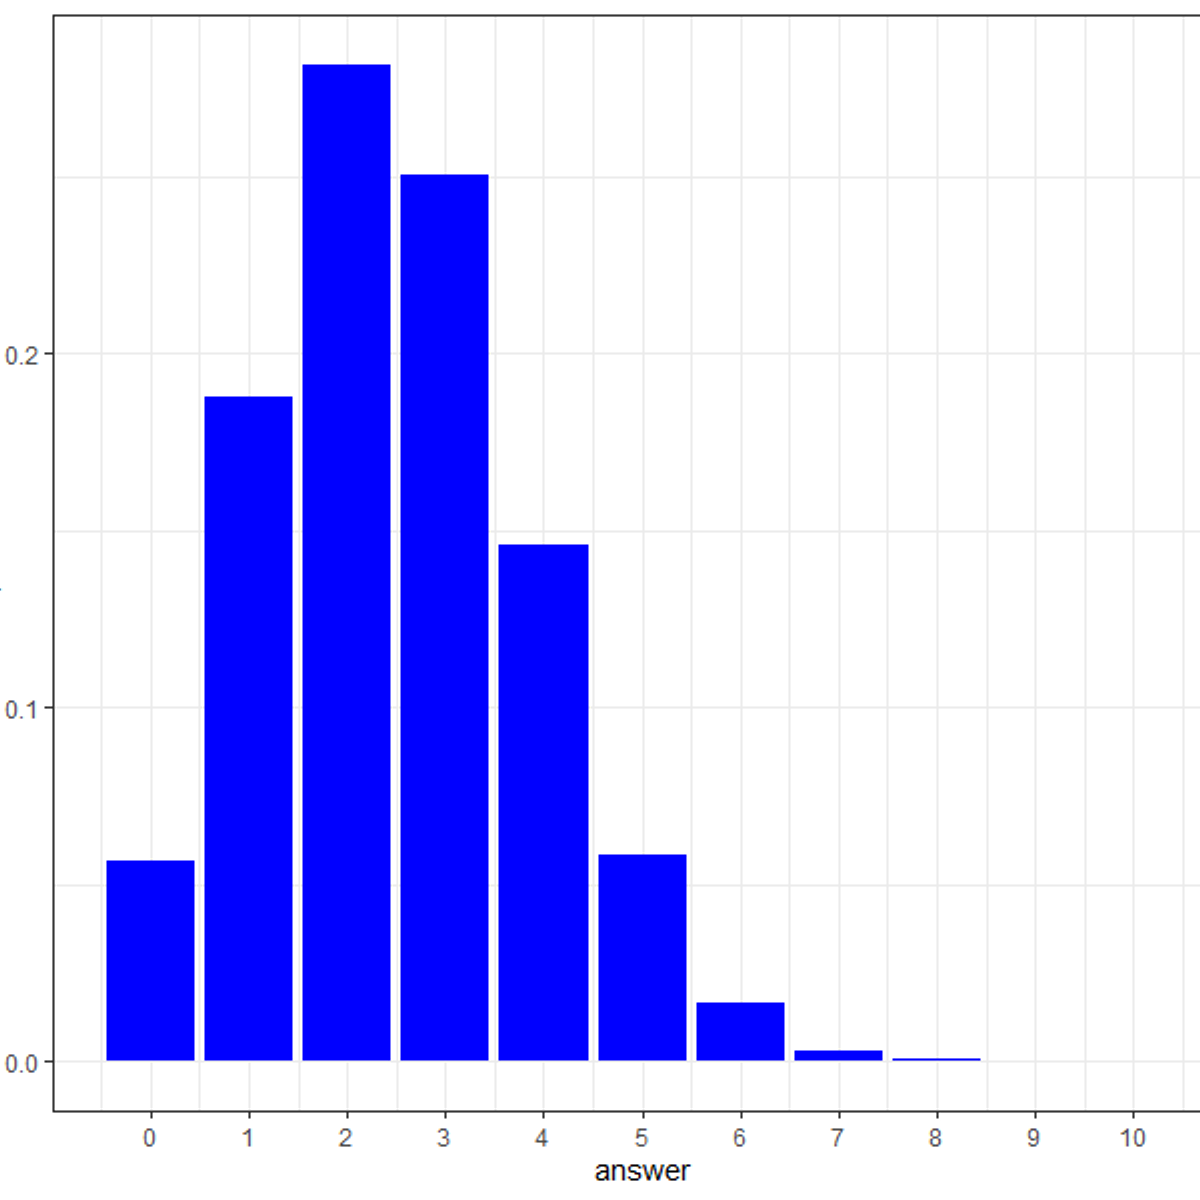
Using probability distributions for real world problems in R
By the end of this project, you will learn how to apply probability distributions to solve real world problems in R, a free, open-source program that you can download. You will learn how to answer real world problems using the following probability distributions – Binomial, Poisson, Normal, Exponential and Chi-square. You will also learn the various ways of visualizing these distributions of real world problems. By the end of this project, you will become confident in understanding commonly used probability distributions through solving practical problems and you will strengthen your core concepts of data distributions using R programming language.
These distributions are widely used in day-to-day life of statisticians for hypothesis testing and drawing conclusions on a population from a small sample. Additionally, in the field of data science, statistical inferences use probability distribution of data to analyze or predict trend from data.
Note: This course works best for learners who are based in the North America region. We’re currently working on providing the same experience in other regions.
Building a Data Science Team
Data science is a team sport. As a data science executive it is your job to recruit, organize, and manage the team to success. In this one-week course, we will cover how you can find the right people to fill out your data science team, how to organize them to give them the best chance to feel empowered and successful, and how to manage your team as it grows.
This is a focused course designed to rapidly get you up to speed on the process of building and managing a data science team. Our goal was to make this as convenient as possible for you without sacrificing any essential content. We've left the technical information aside so that you can focus on managing your team and moving it forward.
After completing this course you will know.
1. The different roles in the data science team including data scientist and data engineer
2. How the data science team relates to other teams in an organization
3. What are the expected qualifications of different data science team members
4. Relevant questions for interviewing data scientists
5. How to manage the onboarding process for the team
6. How to guide data science teams to success
7. How to encourage and empower data science teams
Commitment: 1 week of study, 4-6 hours
Course cover image by JaredZammit. Creative Commons BY-SA. https://flic.kr/p/5vuWZz
Use the Apache Spark Structured Streaming API with MongoDB
By the end of this project, you will use the Apache Spark Structured Streaming API with Python to stream data from two different sources, store a dataset in the MongoDB database, and join two datasets.
The Apache Spark Structured Streaming API is used to continuously stream data from various sources including the file system or a TCP/IP socket. One application is to continuously capture data from weather stations for historical purposes.
Analyze Data to Answer Questions
This is the fifth course in the Google Data Analytics Certificate. These courses will equip you with the skills needed to apply to introductory-level data analyst jobs. In this course, you’ll explore the “analyze” phase of the data analysis process. You’ll take what you’ve learned to this point and apply it to your analysis to make sense of the data you’ve collected. You’ll learn how to organize and format your data using spreadsheets and SQL to help you look at and think about your data in different ways. You’ll also find out how to perform complex calculations on your data to complete business objectives. You’ll learn how to use formulas, functions, and SQL queries as you conduct your analysis. Current Google data analysts will continue to instruct and provide you with hands-on ways to accomplish common data analyst tasks with the best tools and resources.
Learners who complete this certificate program will be equipped to apply for introductory-level jobs as data analysts. No previous experience is necessary.
By the end of this course, you will:
- Learn how to organize data for analysis.
- Discover the processes for formatting and adjusting data.
- Gain an understanding of how to aggregate data in spreadsheets and by using SQL.
- Use formulas and functions in spreadsheets for data calculations.
- Learn how to complete calculations using SQL queries.
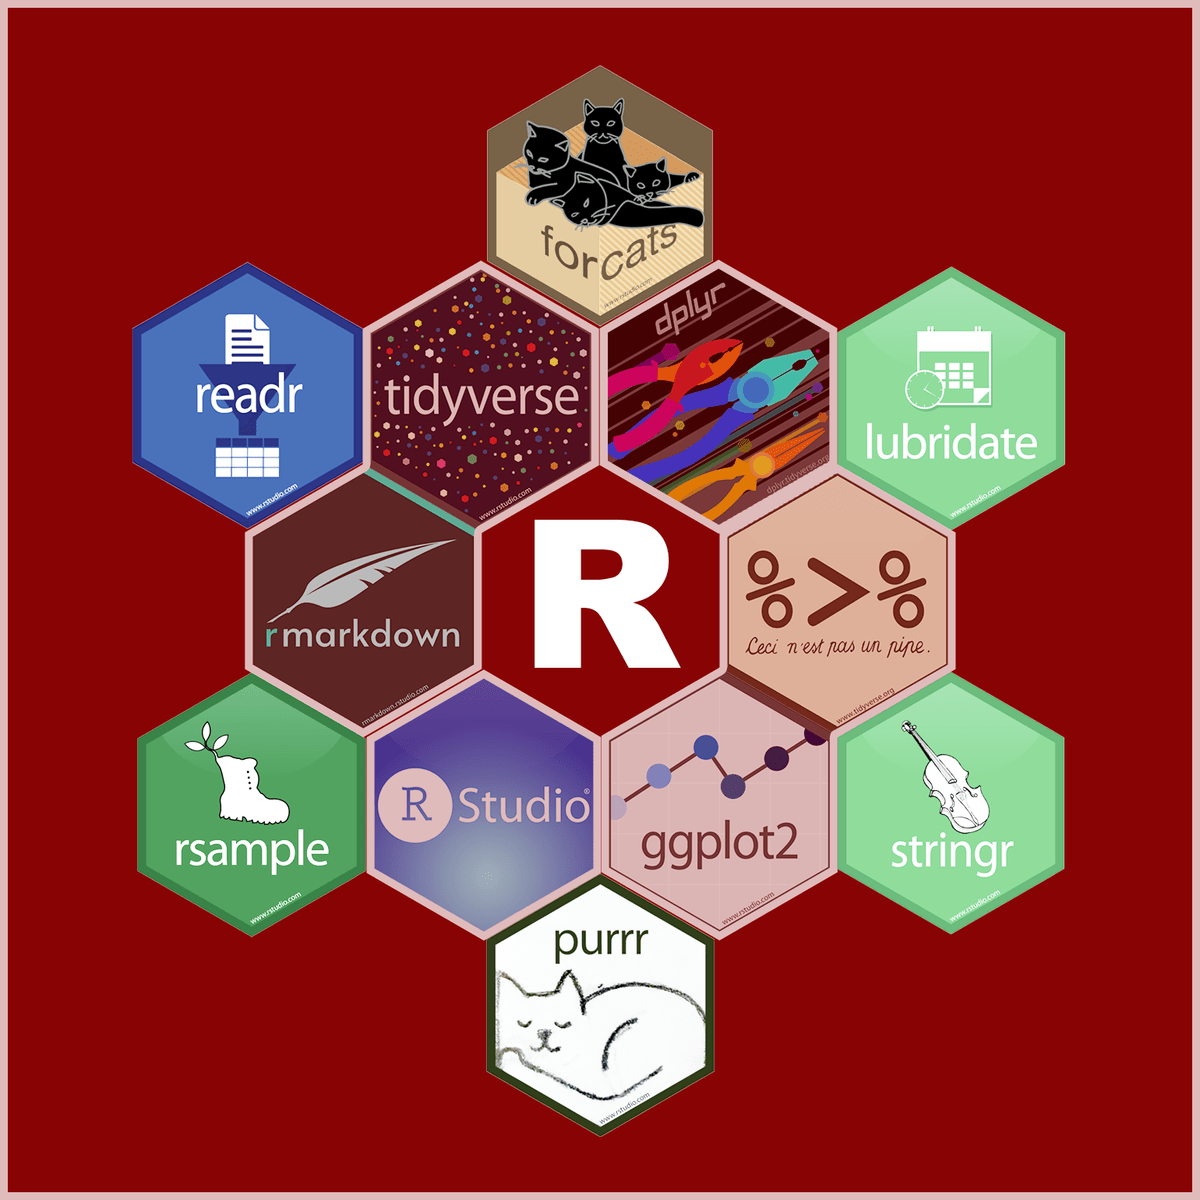
Data Analysis with Tidyverse
This course continues our gentle introduction to programming in R designed for 3 types of learners. It will be right for you, if:
• you want to do data analysis but don’t know programming
• you know programming but aren’t too familiar with R
• you know some R programming but want to learn more about the tidyverse verbs
It is best taken following the first course in the specialization or if you already are familiar with ggplot, RMarkdown, and basic function writing in R. You will use learn to use readr to read in your data, dplyr to analyze your data, and stringr and forcats to manipulate strings and factors.
Business Analytics Capstone
The Business Analytics Capstone Project gives you the opportunity to apply what you've learned about how to make data-driven decisions to a real business challenge faced by global technology companies like Yahoo, Google, and Facebook. At the end of this Capstone, you'll be able to ask the right questions of the data, and know how to use data effectively to address business challenges of your own. You’ll understand how cutting-edge businesses use data to optimize marketing, maximize revenue, make operations efficient, and make hiring and management decisions so that you can apply these strategies to your own company or business. Designed with Yahoo to give you invaluable experience in evaluating and creating data-driven decisions, the Business Analytics Capstone Project provides the chance for you to devise a plan of action for optimizing data itself to provide key insights and analysis, and to describe the interaction between key financial and non-financial indicators. Once you complete your analysis, you'll be better prepared to make better data-driven business decisions of your own.
Music Recommender System Using Pyspark
Nowadays, recommender systems are everywhere. for example, Amazon uses recommender systems to suggest some products that you might be interested in based on the products you've bought earlier. Or Spotify will suggest new tracks based on the songs you use to listen to every day. Most of these recommender systems use some algorithms which are based on Matrix factorization such as NMF( NON NEGATIVE MATRIX FACTORIZATION) or ALS (Alternating Least Square).
So in this Project, we are going to use ALS Algorithm to create a Music Recommender system to suggest new tracks to different users based upon the songs they've been listening to. As a very important prerequisite of this course, I suggest you study a little bit about ALS Algorithm because in this course we will not cover any theoretical concepts.
Note: This project works best for learners who are based in the North America region. We’re currently working on providing the same experience in other regions.
Popular Internships and Jobs by Categories
Browse
© 2024 BoostGrad | All rights reserved