
Back to Courses


Design And Product Courses - Page 23
Showing results 221-230 of 512
Create a Project Tracker with Airtable
Airtable is a cloud collaboration service that combines the features of databases and spreadsheets. In this 1.5 hour guided project, you will learn the basics of relational database and get up to speed with Airtable and create a project tracker. No prior experience is required. Although experience with spreadsheets is helpful. A free account with Airtable is required. Signing up before starting the class is recommended.
How to create presentations using Canva
In this project you will learn how to make presentations using Canva. Canva is a free web design service where you have a wide variety of tools to design all kinds of media you need. Canva is a great option for those looking for an easy-to-use platform to create presentations for corporate, school, and college classes. Canva has many elements that are free and gives you a lot of freedom when it comes to designing. Canva is an extremely useful tool for those who are just starting out and even becomes a very good tool for those who have been designing in more advanced programs for years. It is a quick option that does not need to be installed on your computer and as long as you have an internet connection, it will be an accessible tool. Additionally, it offers a number of templates that facilitate the creative process and a presentation platform where you can use any medium, from images to videos.
Image Processing with Python
Image processing has been used to create weird and beautiful modifications to pictures many of us have seen online. Older black and white photos can be brought to life using colorization techniques. On the other hand, color photos can be made to look like old black and white photos. In addition to distorting images for entertainment, image processing can be used for more serious applications, for example, to enhance medical imaging to screen patients for cancer or other diseases.
In this tutorial, you will create a Python application that reads from a list of images, modifies their size and appearance, and saves the images in another directory.
Note: This tutorial works best for learners who are based in the North America region. We’re currently working on providing the same experience in other regions.
Learn PHP Database Connectivity
In this 1.5-hours long project-based course, you will (Learn PHP database connectivity , Build Web pages with
back-end database).
You will learn PHP database connectivity functions , how to connect into a back-end database, how to insert data into a database and modify them with PHP scripts.
You will learn to work with XAMPP server and MySQL as a back-end database and by the end of this project you will be able to create professional web apps with back-end database.
Note: This course works best for learners who are based in the North America region. We’re currently working on providing the same experience in other regions.
How to use the perspective grid tool in Adobe Illustrator
In this project you will learn how to use the perspective grid tool in Adobe Illustrator.
This tool allows you to put any design, shape, or text into perspective and it's extremely useful when designing. This tool elevates your value as a graphic designer and being able to use it and understand how it's used is awesome. Many tools are ignored in Adobe Illustrator and what makes you shine and be the graphic designer your client needs is to have the ability to use any tool to make your job even better.
In this guided project you'll learn how to use the perspective grid in one point, two point, and three point perspective and you'll apply designs in every scenario. You will also design a realistic 3D packaging Mock Up. I hope you are excited to learn more about Adobe Illustrator. Let's go ahead and start!
Understanding Smart Objects in Adobe Photoshop
By the end of this project, you’ll be able to create and edit smart objects in Adobe Photoshop. You’ll use smart objects to apply nondestructive edits and swap assets inside files.
During this project, you’ll get used to navigating some important Photoshop tools and practice creating and importing smart objects, and you’ll learn what makes them smart in the first place. Then you’ll apply nondestructive edits and work with different kinds of smart objects. Once you’re finished, you’ll learn how to export your work.
By the end of the project, you’ll be able to use smart objects to make smart and speedy edits to images.
Inspect ADA Compliance with Chrome Screen Reader Extensions
By the end of this project, you will be able to confidently leverage Chrome browser extensions to test information accessibility, so that you can ensure that as much of your audience as possible can intuitively take in and interact with your organization’s information.
To do this, you will gain hands-on experience working with the free screen reader extension in your Google Chrome browser.
Note: This course works best for learners who are based in the North America region. We’re currently working on providing the same experience in other regions.
Introduction to Augmented Reality and ARCore
This class will teach you the fundamentals of augmented reality (AR), and how to build an AR experience using ARCore. Through the four week course, you'll learn:
- How to identify different types of AR experiences
- Tools and platforms used in the AR landscape
- What makes AR feel "real"
- Popular use cases for AR
- How to create an AR use flow
- How AR experiences work
- Tools like Google Poly and Unity to build AR experiences
- Next steps to start building an AR experience using ARCore and other tools
This course will break down complex AR concepts to make them easy to understand, while also sharing expert tips and knowledge from Daydream's ARCore team. The course is great for beginners who are just getting started with AR or ARCore.
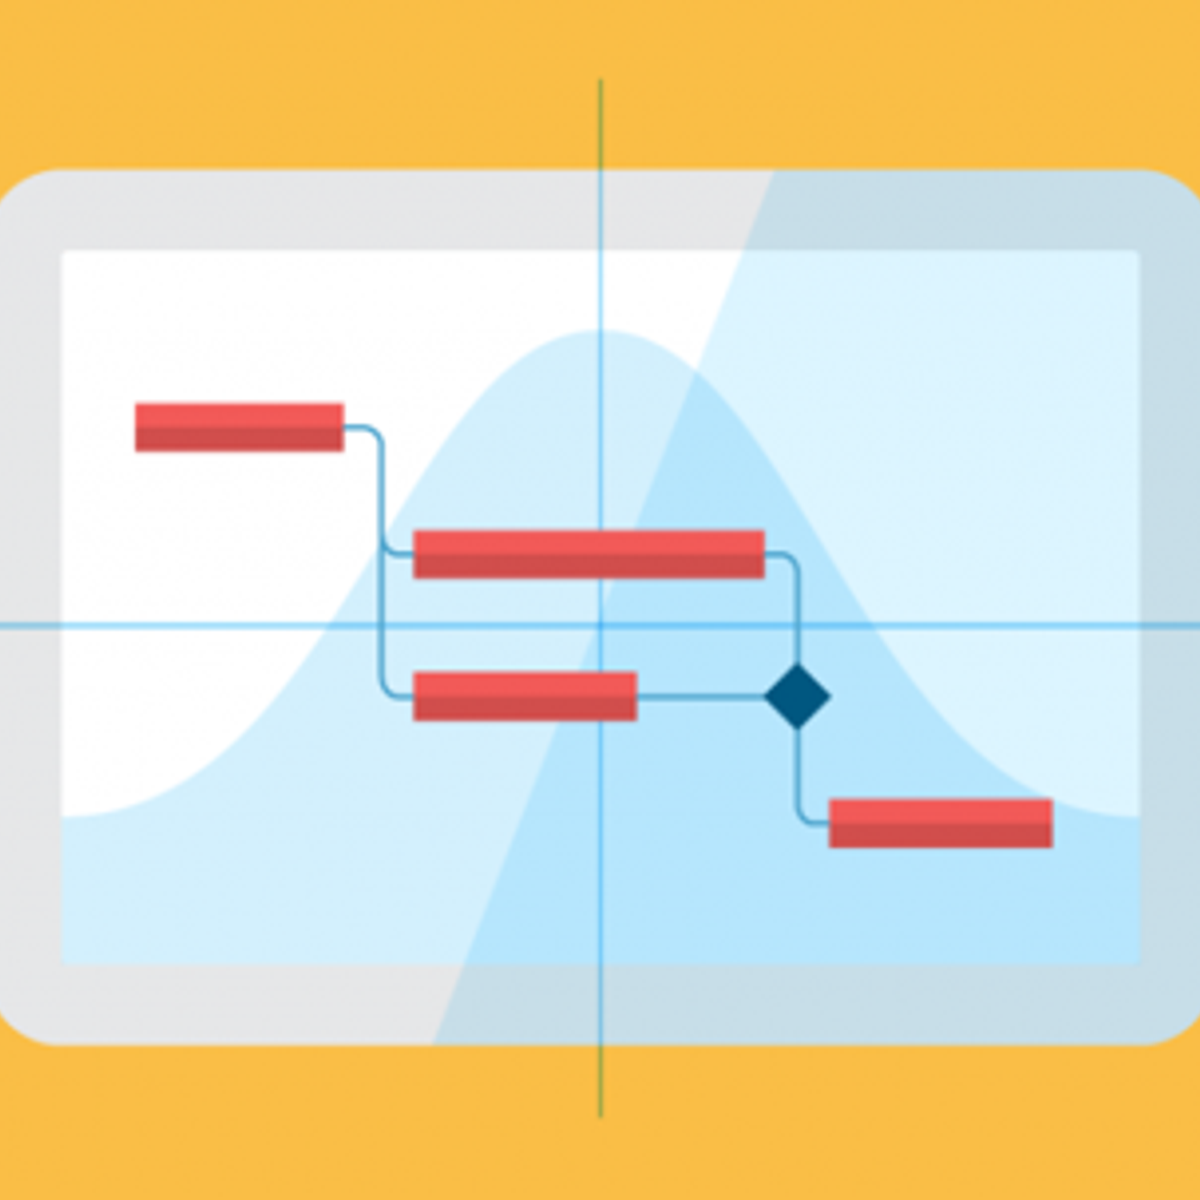
Visualize Project Milestones with Gantt Charts in Miro
By the end of this project, you will be able to leverage Gantt charts to plan, schedule, and graphically represent the progression of a project plan over time so that stakeholders and sponsors can quickly understand the status, dependencies, and future requirements.
To do this, you will gain hands-on experience applying, planning and scheduling a project by creating a Gantt chart in the Miro online visual collaboration platform for teamwork.
Note: This course works best for learners who are based in the North America region. We’re currently working on providing the same experience in other regions.
Visualize Financial Data In Tableau
Tableau is widely recognized as one of the premier data visualization software programs. For many years access to the program was limited to those who purchased licenses. Recently, Tableau launched a public version that grants the ability to create amazing data visualizations for free. Account members can also share and join projects to collaborate on projects that can change the world.
Like many other areas of business, finance departments of all sizes are harnessing the power of data to make better more profitable decisions. With tools like Tableau, finance does not have to be confined to the columns and rows of a spreadsheet. But can now be visualized in dynamic almost life-like ways.
In this project, we will learn how to create an account and how to create visualizations for common financial reports, including accounts receivables, profit and loss, and cash flow.
Popular Internships and Jobs by Categories
Browse
© 2024 BoostGrad | All rights reserved