Back to Courses


Business Courses - Page 82
Showing results 811-820 of 2058

Seeking Investment Alpha
In this 1-hour long project-based course, you will learn how to use beta to compare stock’s exposure to the systematic risk and use alpha to quantify the investment’s return over the market return.
ATTENTION: To take this course, it is required that you are familiar basic financial risk management concepts. You can gain them by taking the guided project Compare Stock Returns with Google Sheets.
Note: This course works best for learners who are based in the North America region. We're currently working on providing the same experience in other regions.
This course's content is not intended to be investment advice and does not constitute an offer to perform any operations in the regulated or unregulated financial market

Completing the Accounting Cycle
Students prepare statements relevant to year end accounting processes synthesizing what they have learned in the previous two courses. Specific topics include adjusting entries, closing entries (with a focus on the adjustment to retained earnings), the preparation of an income statement, retained earnings statement, and a balance sheet, and the procedure for recording the four closing entries. Students will also learn how to prepare the post-closing trial balance.

Create a quiz using Microsoft Forms
At the end of this project you will have created an online questionnaire, aimed at students, employees, or your team. The responses are accumulated in the Forms online portal and then you can access statistical information related to the data. Microsoft Forms is an amazing tool for educators and businesses.

Create a Glossary in Microsoft Word 365
Long and technical documents may need a glossary of terms at the end of the document to assist readers in understanding the terminology used. Microsoft Word 365 is a free program available online that can be used to create a high-quality, effective glossary.
Learners taking this project will walk through how to create a glossary in an easy-to-follow, step-by-step format. Starting with preparing a blank document or using a prepared example document, learners will then learn how to format the text in the glossary and how to write highly effective definitions. Next, learners will discover how to format the glossary in two different ways, paragraph and table formats.
By the end of this project, learners will be confident in creating and formatting a glossary of terms that they can easily add at the end of any document to inform and engage readers.

Statistics for Marketing
This course takes a deep dive into the statistical foundation upon which Marketing Analytics is built. The first part of this course is all about getting a thorough understanding of a dataset and gaining insight into what the data actually means. The second part of this course goes into sampling and how to ask specific questions about your data. Finally, the third part is about answering those questions with analyses. Many of the mistakes made by Marketing Analysts today are caused by not understanding the concepts behind the analytics they run, which causes them to run the wrong test or misinterpret the results. This course is specifically designed to give you the background you need to understand what you are doing and why you are doing it on a practical level.
By the end of this course you will be able to:
• Understand the concept of dependent and independent variables
• Identify variables to test
• Understand the Null Hypothesis, P-Values, and their role in testing hypotheses
• Formulate a hypothesis and align hypotheses with business goals
• Identify actions based on hypothesis validation/invalidation
• Explain Descriptive Statistics (mean, median, standard deviation, distribution) and their use cases
• Understand basic concepts from Inferential Statistics
• Explain the different levels of analytics (descriptive, predictive, prescriptive) in the context of marketing
• Create basic statistical models for regression using data
• Create time-series forecasts using historical data and basic statistical models
• Understand the basic assumptions, use cases, and limitations of Linear Regression
• Fit a linear regression model to a dataset and interpret the output using Tableau and statsmodels
• Explain the difference between linear and multivariate regression
• Run a segmentation (cluster) analysis
• Describe the difference between observational methods and experiments
This course is designed for people who want to learn the basics of descriptive and inferential statistics and analytics in marketing.
Learners don't need marketing or data analysis experience, but should have basic internet navigation skills and be eager to participate. Ideally learners have already completed course 1 (Marketing Analytics Foundation) and course 2 (Introduction to Data Analytics) in this program.

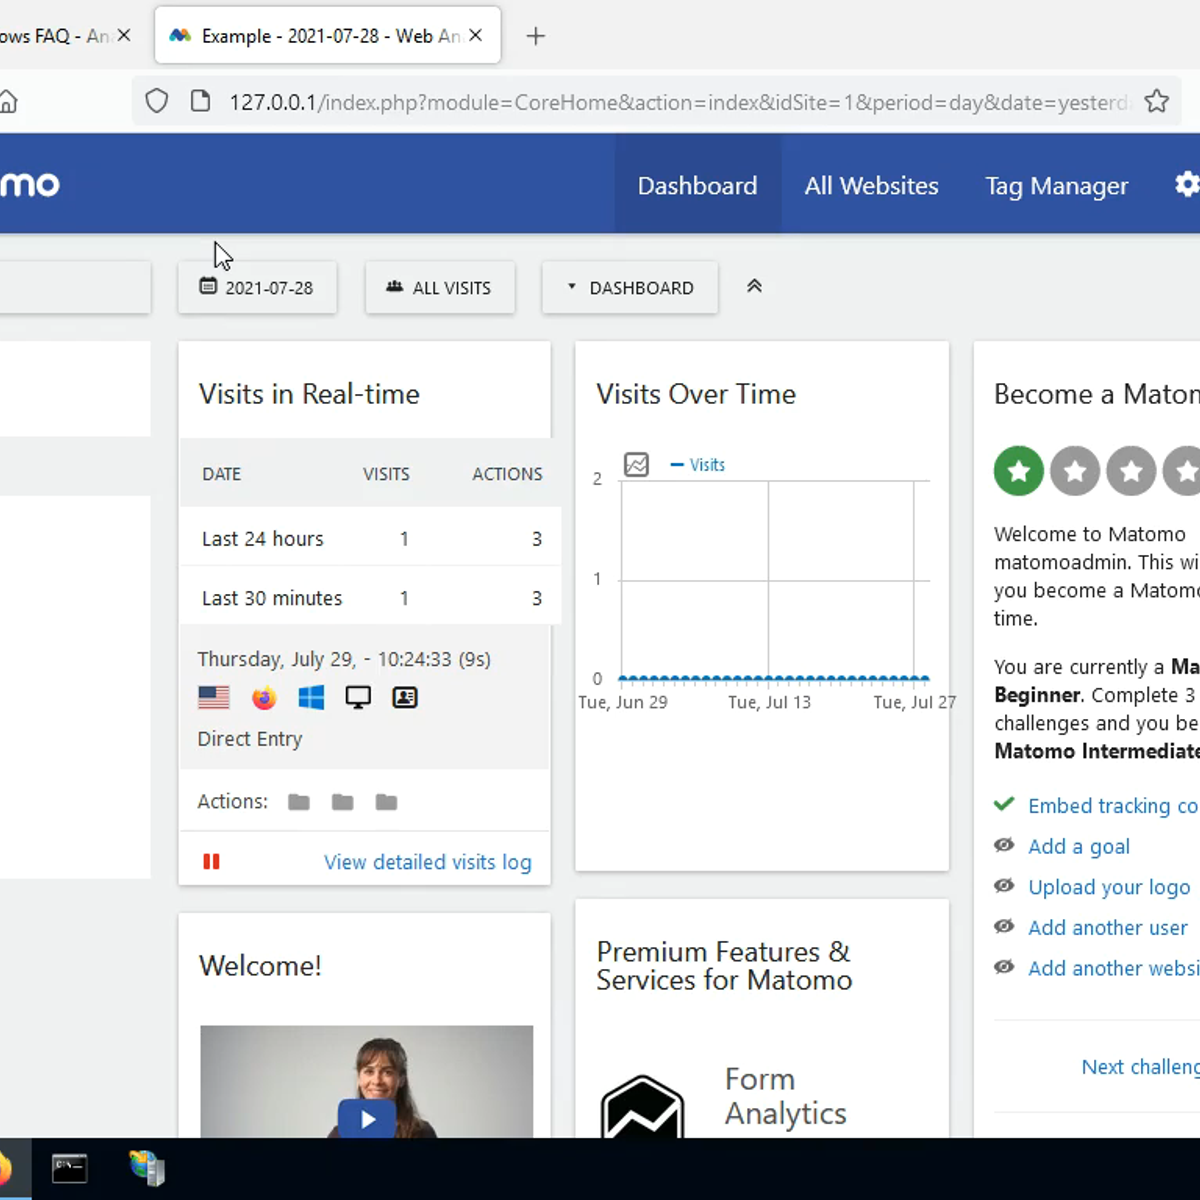
Install and use Matomo on Windows IIS server
Learn how to install and use Matomo, leading free open source web analytics software, on Windows IIS server for local testing or production

Digital Business - Understand the digital world
Facebook, AirBnB, Tesla, Amazon, Uber. In just a few years, companies like these have changed the face of the global economy. Meanwhile, hundreds of thousands of start-ups are disrupting old business models, taking on centennial industrial groups – and winning. It’s clear that the rules of business have changed forever.
This MOOC provides a knowledge toolkit for the ongoing digital revolution. You’ll discover 10 concepts that are essential for understanding the new mechanisms of digital business and innovation.
Each concept is explained in its own beautifully designed, content-rich instructional video, along with additional resources for you to explore. The ideas are illustrated with up-to-the-minute case studies and examples from a wide range of industries.
Week 1 : Why Digital Changes Everything
Week 2 : Creating Value in a Digital World
Week 3 : Thinking and Acting Differently
This MOOC is ideal for learners from a wide range of backgrounds. It is brought to you by three expert professors and researchers from IMT - Telecom Paris, a leading European graduate school in the field of digital technology and social science.
This MOOC is supported by the Patrick and Lina Drahi Foundation.

Strategic Management - Capstone Project
In this capstone project course, we revisit the strategy controversy at e-Types, introduced in the first course in this specialization, Strategic Management, and further analysed in each of the subsequent courses, Strategy Formulation and Strategy Implementation. After revealing, examining, and analyzing what happened at e-Types, we turn to a new set of strategy cases that range in terms of company size, geography, and focus. For your final project, we ask YOU to apply everything you have learned in this specialization to analyze your choice of one of these four situations.

Create Charts and Dashboards Using Microsoft Excel
In this project, you will learn how to create charts in Microsoft Excel to analyze sales data of a sample company. You will learn how to create PivotTables to assess different aspects of the sales information, and represent the information from the tables as line, bar, and pie charts. When creating the charts, you will learn how to format them so they are easily interpreted and you will then assemble the charts in a dashboard to provide a global picture of the sales data.

The Econometrics of Time Series Data
In this course, you will look at models and approaches that are designed to deal with challenges raised by time series data. The discussion covers the motivation for the use of particular models and the description of the characteristics of time series data, with a special attention raised to the potential memory. You will:
– Discuss time series models, that refer to data that have been collected over a period on one or more variables for the same individual.
– Explore both on stationary and non-stationary time series models, as well as the difference between the non-stationary data and the trend-stationary processes
– Consider the problems that may occur with non-stationarity data.
– Discover the applications of time series models that are of use when we want to model the GDP growth of an economy, and to test for the Purchasing Power Parity Hypothesis.
– Explore the idea of forecasting using econometric models.
– Discuss different criteria to decide how good your in-sample and out-of-sample forecasts are.
– Explore the problem raised by data where the variance is non-constant, and models for volatility forecasting.
– Estimate ARCH(p) and GARCH(p,q) models for volatility with real financial market data and present how to extend these models to the mean of the time series via Garch-in-mean.
It is recommended that you have completed and understood the previous three courses in this Specialisation: The Classical Linear Regression Model, Hypothesis Testing in Econometrics and Topics in Applied Econometrics.
By the end of this course, you will be able to:
– Manipulate and plot the different types of data
– Estimate and interpret the empirical autocorrelation function
– Estimate and compare models for stationary series
– Test for non-stationarity of time series data
– Estimate and interpret cointegration equations
– Perform in-sample and out-of-sample forecasting exercises
– Estimate and compare models for changing volatility
Popular Internships and Jobs by Categories
Browse
© 2024 BoostGrad | All rights reserved


