Back to Courses


Math And Logic Courses - Page 9
Showing results 81-90 of 148
College Math Prep
The College Math Prep MOOC is targeted at students preparing to enter college and who need to take the Math Placement Exam. Information in this course applies to all students who take the CollegeBoard Accuplacer Exam. However, there is information in the MOOC that is specifically tailored to Texas students because of initiatives set forth by the Texas Higher Education Coordinating Board.
Fitting Statistical Models to Data with Python
In this course, we will expand our exploration of statistical inference techniques by focusing on the science and art of fitting statistical models to data. We will build on the concepts presented in the Statistical Inference course (Course 2) to emphasize the importance of connecting research questions to our data analysis methods. We will also focus on various modeling objectives, including making inference about relationships between variables and generating predictions for future observations.
This course will introduce and explore various statistical modeling techniques, including linear regression, logistic regression, generalized linear models, hierarchical and mixed effects (or multilevel) models, and Bayesian inference techniques. All techniques will be illustrated using a variety of real data sets, and the course will emphasize different modeling approaches for different types of data sets, depending on the study design underlying the data (referring back to Course 1, Understanding and Visualizing Data with Python).
During these lab-based sessions, learners will work through tutorials focusing on specific case studies to help solidify the week’s statistical concepts, which will include further deep dives into Python libraries including Statsmodels, Pandas, and Seaborn. This course utilizes the Jupyter Notebook environment within Coursera.
Introduction to C++ Programming: Create a Tic-Tac-Toe Game
By the end of this project you will create a fully functioning Tic-Tac-Toe game on a console application in which 2 players could play against each other, this will be achieved through applying and practicing many concepts of programming which programmers use all the time through their programming careers such as advanced if statements, advanced arithmetic operations, loops, Arrays, and 2D arrays. By applying these concepts you will also be able to create different types of programs that users can interact with. These programming concepts can also be applied using other Programming Languages such as Java and Python, not just C++.
Prerequisites: Familiarity with the basics as variables, data types, if-statements and basic arithmetic operations in programming for which it's recommended you take "Introduction to C++ Programming: Build a Calculator".
Note: This course works best for learners who are based in the North America region. We’re currently working on providing the same experience in other regions.
Everyday Excel, Part 2
"Everyday Excel, Part 2" is a continuation of the popular "Everyday Excel, Part 1". Building on concepts learned in the first course, you will continue to expand your knowledge of applications in Excel. This course is aimed at intermediate users, but even advanced users will pick up new skills and tools in Excel. By the end of this course, you will have the skills and tools to take on the project-based "Everyday Excel, Part 3 (Projects)".
This course is the second part of a three-part series and Specialization that focuses on teaching introductory through very advanced techniques and tools in Excel. In this course (Part 2), you will: 1) learn advanced data management techniques; 2) learn how to implement financial calculations in Excel; 3) use advanced tools in Excel (Data Tables, Goal Seek, and Solver) to perform and solve "what-if" analyses; 4) learn how to create mathematical predictive regression models using the Regression tool in Excel.
This course is meant to be fun and thought-provoking. I hope for you to at least several times in the course say to yourself, "Wow, I hadn't thought of that before!" Given the wide range in experience and abilities of learners, the goal of the course is to appeal to a wide audience. The course is organized into 5 Weeks (modules).
To pass each module, you'll need to pass a mastery quiz and complete a problem solving assignment. This course is unique in that the weekly assignments are completed in-application (i.e., on your own computer in Excel), providing you with valuable hands-on training.
Scatter Plot for Data Scientists & Big Data Analysts-Visuals
This project gives you easy access to the invaluable learning techniques used by experts for visualization in statistics. We’ll learn about how to use wolfram language to draw curve in easiest way. We’ll also cover illustration and best practices shown by research to be most effective in helping you master plotting curves.
Using these approaches, no matter what your skill levels in topics you would like to master, you can change your thinking and change your life. If you’re already an expert, this peep under the mental hood will give you ideas for turbocharging successful learning, including counter-intuitive test-taking tips and insights that will help you make the best use of your time on homework and problem sets. If you’re struggling, you’ll see a structured treasure trove of practical techniques that walk you through what you need to do to get on track. If you’ve ever wanted to become better at anything, this project will help serve as your guide.
In this project we will take some illustrations and be able to Visualize the data by Scatter Plot using Wolfram Mathematica.
By the end of this project learners will:
Be able to plot basic examples (list of y values and x y pair)& several data items with legends (labeling each Plot and each data item)
Be able to plot values including 'units' and using individual 'color' for each point
Be able to plot the range where the data is non real are excluded & function ranges where it is selected automatically.
Precalculus: Relations and Functions
This course helps to build the foundational material to use mathematics as a tool to model, understand, and interpret the world around us. This is done through studying functions, their properties, and applications to data analysis. Concepts of precalculus provide the set of tools for the beginning student to begin their scientific career, preparing them for future science and calculus courses. This course is designed for all students, not just those interested in further mathematics courses. Students interested in the natural sciences, computer sciences, psychology, sociology, or similar will genuinely benefit from this introductory course, applying the skills learned to their discipline to analyze and interpret their subject material. Students will be presented with not only new ideas, but also new applications of an old subject. Real-life data, exercise sets, and regular assessments help to motivate and reinforce the content in this course, leading to learning and mastery.
Six Sigma Tools for Analyze
This course will cover the Measure phase and portions of the Analyze phase of the Six Sigma DMAIC (Define, Measure, Analyze, Improve, and Control) process. You will learn about lean tools for process analysis, failure mode and effects analysis (FMEA), measurement system analysis (MSA) and gauge repeatability and reproducibility (GR&R), and you will be introduced to basic statistics. This course will outline useful measure and analysis phase tools and will give you an overview of statistics as they are related to the Six Sigma process.
The statistics module will provide you with an overview of the concepts and you will be given multiple example problems to see how to apply these concepts. Every module will include readings, discussions, lecture videos, and quizzes to help make sure you understand the material and concepts that are studied.
Our applied curriculum is built around the latest handbook The Certified Six Sigma Handbook (2nd edition) and students will develop /learn the fundamentals of Six Sigma. Registration includes online access to course content, projects, and resources but does not include the companion text The Certified Six Sigma Handbook (2nd edition). The companion text is not required to complete the assignments. However, the text is a recognized handbook used by professionals in the field. Also, it is a highly recommended text for those wishing to move forward in Six Sigma and eventually gain certification from professional agencies such as American Society for Quality (ASQ).
Bayesian Statistics: From Concept to Data Analysis
This course introduces the Bayesian approach to statistics, starting with the concept of probability and moving to the analysis of data. We will learn about the philosophy of the Bayesian approach as well as how to implement it for common types of data. We will compare the Bayesian approach to the more commonly-taught Frequentist approach, and see some of the benefits of the Bayesian approach. In particular, the Bayesian approach allows for better accounting of uncertainty, results that have more intuitive and interpretable meaning, and more explicit statements of assumptions. This course combines lecture videos, computer demonstrations, readings, exercises, and discussion boards to create an active learning experience. For computing, you have the choice of using Microsoft Excel or the open-source, freely available statistical package R, with equivalent content for both options. The lectures provide some of the basic mathematical development as well as explanations of philosophy and interpretation. Completion of this course will give you an understanding of the concepts of the Bayesian approach, understanding the key differences between Bayesian and Frequentist approaches, and the ability to do basic data analyses.
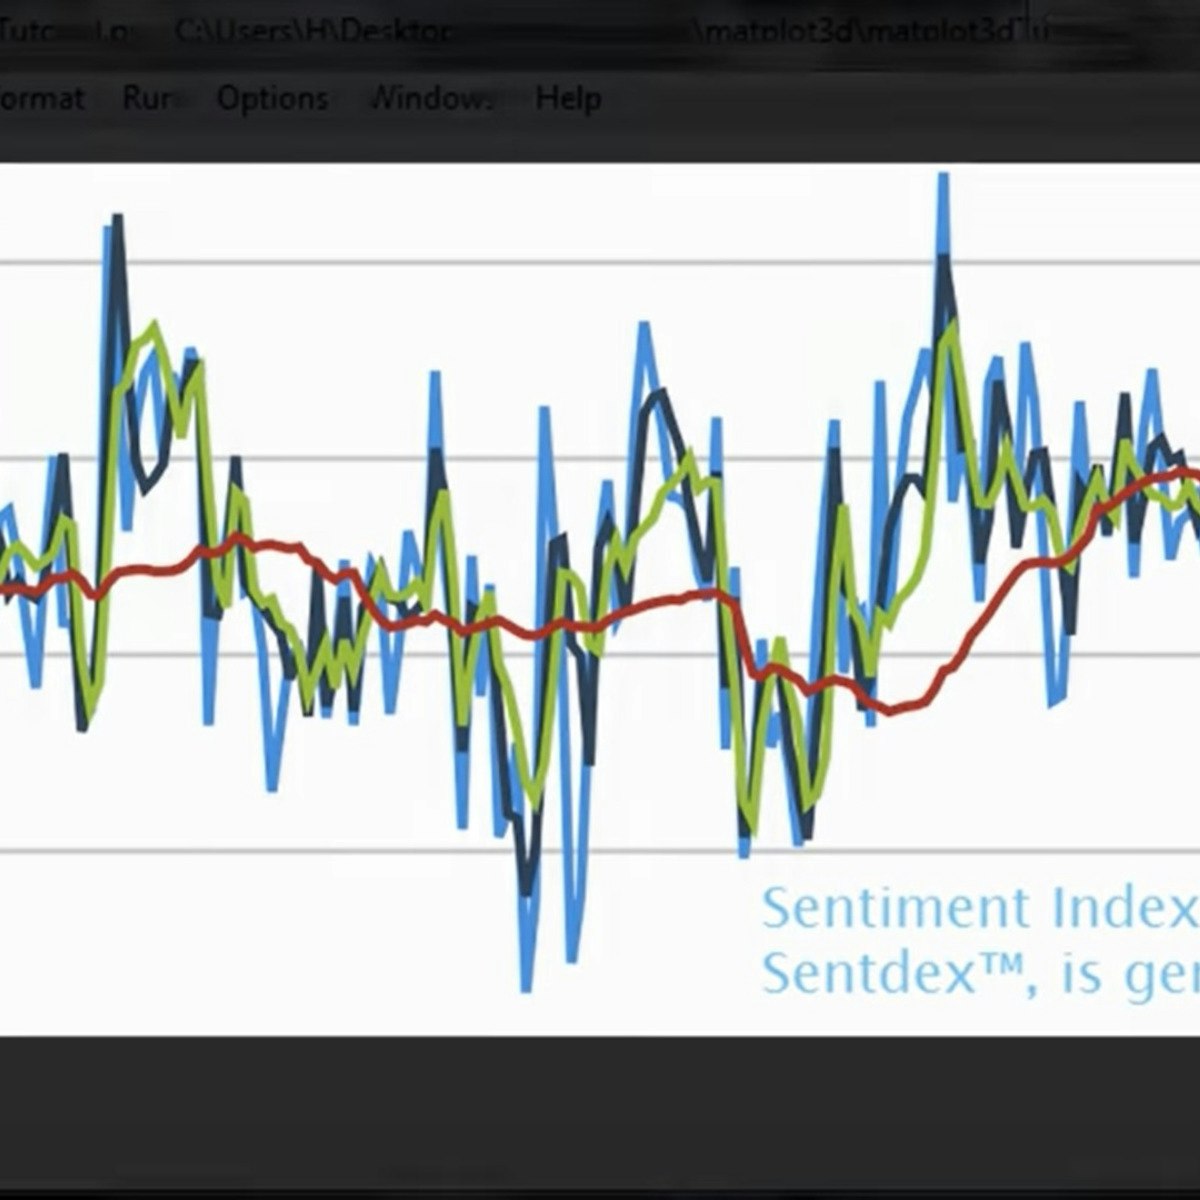
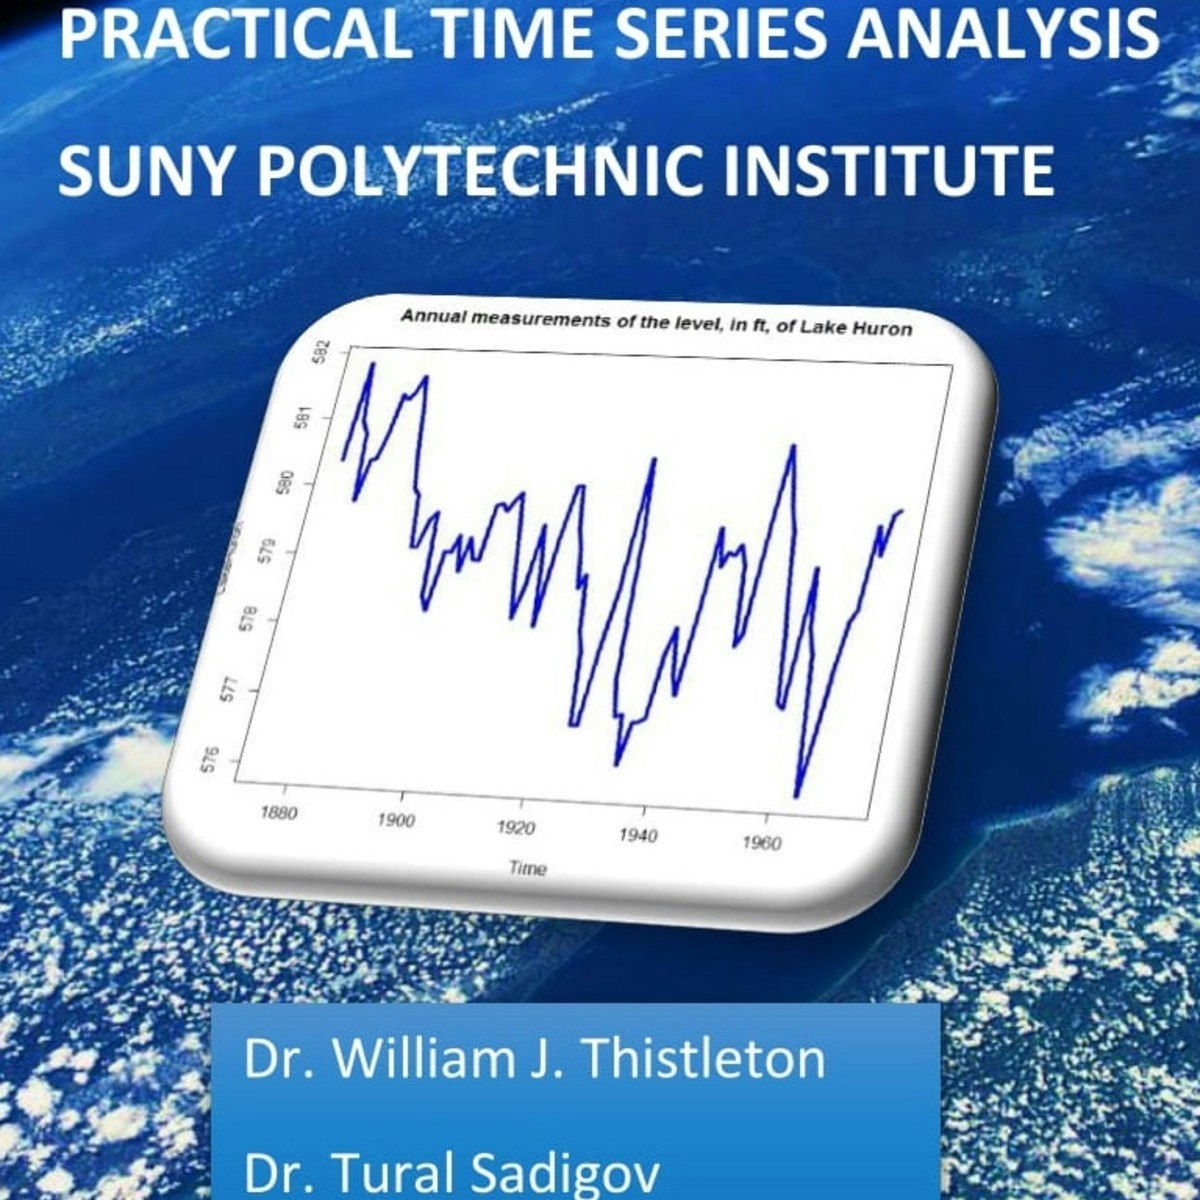
Practical Time Series Analysis
Welcome to Practical Time Series Analysis!
Many of us are "accidental" data analysts. We trained in the sciences, business, or engineering and then found ourselves confronted with data for which we have no formal analytic training. This course is designed for people with some technical competencies who would like more than a "cookbook" approach, but who still need to concentrate on the routine sorts of presentation and analysis that deepen the understanding of our professional topics.
In practical Time Series Analysis we look at data sets that represent sequential information, such as stock prices, annual rainfall, sunspot activity, the price of agricultural products, and more. We look at several mathematical models that might be used to describe the processes which generate these types of data. We also look at graphical representations that provide insights into our data. Finally, we also learn how to make forecasts that say intelligent things about what we might expect in the future.
Please take a few minutes to explore the course site. You will find video lectures with supporting written materials as well as quizzes to help emphasize important points. The language for the course is R, a free implementation of the S language. It is a professional environment and fairly easy to learn.
You can discuss material from the course with your fellow learners. Please take a moment to introduce yourself!
Time Series Analysis can take effort to learn- we have tried to present those ideas that are "mission critical" in a way where you understand enough of the math to fell satisfied while also being immediately productive. We hope you enjoy the class!
Graph Search, Shortest Paths, and Data Structures
The primary topics in this part of the specialization are: data structures (heaps, balanced search trees, hash tables, bloom filters), graph primitives (applications of breadth-first and depth-first search, connectivity, shortest paths), and their applications (ranging from deduplication to social network analysis).
Popular Internships and Jobs by Categories
Find Jobs & Internships
Browse


© 2024 BoostGrad | All rights reserved