Back to Courses


Business Essentials Courses
Showing results 1-10 of 645
Use SurveyMonkey to Create a Survey and Analyze Results
In this project, we will walk through the survey making process and explore the many ways that SurveyMonkey streamlines and simplifies data collection. We will learn how the program is organized and how it operates, helping you feel comfortable and confident enough to create your own survey to meet your own individual needs.
SurveyMonkey is a cloud based survey software which allows its users to create online surveys for free. SurveyMonkey can help move a business in the right direction by collecting the opinions and thoughts of their employees, shareholders, customers, or any other invested group of individuals. After creating a survey with SurveyMonkey, you can easily email them to your target audience or post them on social media. The question templates provided by SurveyMonkey make creating a professional and thorough survey quick and easy. Its user friendly features and detailed options allow amateurs and marketing gurus alike to create the perfect survey to meet their needs.
Note: This course works best for learners who are based in the North America region. We’re currently working on providing the same experience in other regions.
Create a Cover Letter with an Envelope using Microsoft Word
After successfully completing this project, you will have created a cover letter and an envelope using Microsoft Word.
While composing a cover letter, you will use various features in Word such as headers, styles, and page size. You will also learn how to adjust page margins and use the markers on the ruler. This project is useful for learning the basic features in Word to create a formal block style letter and envelope.
Successful Presentation
Few kinds of communication can have the effect of a powerful presentation. Even a short speech can motivate people to change long-held beliefs or to take action, and a wonderfully delivered speech can transform a normal person into a leader.
In this course, Prof. William Kuskin provides a series of pragmatic videos and exercises for successful public speaking and presentations. The course develops through four themes—mastering fear, developing a creative formula, using verbal and body language, and anticipating the room—so that you can discover your personal power as a speaker and give excellent presentations.
Successful presentations do not rely on perfect teeth, a deep voice, or an army of scriptwriters. They depend largely on the same skills as successful Business Writing and Graphic Design: clarity, structure, and revision. The goal of the course, therefore, is to enable you to discover your own internal power as a speaker and express it to the world. After this course, with some practice, you will be able to go into any situation and command the room for as long as you like.
This course can be taken for academic credit as part of CU Boulder’s Master of Science in Data Science (MS-DS) degree offered on the Coursera platform. The MS-DS is an interdisciplinary degree that brings together faculty from CU Boulder’s departments of Applied Mathematics, Computer Science, Information Science, and others. With performance-based admissions and no application process, the MS-DS is ideal for individuals with a broad range of undergraduate education and/or professional experience in computer science, information science, mathematics, and statistics. Learn more about the MS-DS program at https://www.coursera.org/degrees/master-of-science-data-science-boulder.
كابستون: تطبيق إدارة المشروعات في العالم الحقيقي
في دورة كابستون أو الدورة النهائية الأخيرة هذه لشهادة إدارة المشروعات من Google، ستتدرب على تطبيق معرفة ومهارات إدارة المشروعات التي تعلمتها حتى الآن. نشجع المتعلمين على إكمال الدورات 1-5 قبل بدء الدورة النهائية، حيث أنها توفر الأساس اللازم لإكمال الأنشطة في هذه الدورة.
أثناء تقدمك في هذه الدورة التدريبية، سوف "تراقب" مدير المشروعات في سيناريو العالم الحقيقي وستكمل العشرات من الأنشطة العملية. وسوف تقوم بما يلي:
- تحليل وثائق المشروع لتحديد متطلبات المشروع وتقييم الأطراف المعنية
- إكمال ميثاق المشروع واستخدمه كأداة لمواءمة نطاق المشروع وأهدافه بين الأطراف المعنية
- تحديد المهام والمعالم الرئيسية وتوثيقها وتحديد أولوياتها في خطة المشروع
- تحديد معايير إدارة الجودة واستكشاف كيفية مشاركة البيانات النوعية بشكل فعال
- إظهار تأثير مشروعك من خلال التقارير الفعالة
بنهاية هذه الدورة التدريبية، ستكون قد اكتسبت مجموعة من أدوات إدارة المشروع والتي ستوضح المهارات التي تعلمتها خلال البرنامج بأكمله، مثل قدرتك على إدارة الأطراف المعنية والفرق وتنظيم الخطط وتوصيل تفاصيل المشروع. يمكن أن تظهر هذه الأدوات استعدادك الوظيفي عند التقدم بطلب للحصول على وظائف في هذا المجال. لمزيد من الإعداد للمقابلة لوظائف إدارة المشروعات، سوف تفكر في المشروعات السابقة، وإعداد "عرض ترويجي قصير"، وتتوقع أسئلة المقابلة الشائعة. سيستمر مديرو مشروعات Google الحاليون في إرشادك وتزويدك بالاستراتيجيات والأدوات والموارد لتحقيق أهدافك.
بعد الانتهاء من هذا البرنامج، يجب أن تكون مجهزا للتقدم بطلب للحصول على وظائف على المستوى التمهيدي كمدير مشروعات. ستتاح لك أيضًا الفرصة للمطالبة بشهادة الإنجاز التي ستكون معروفة لدى أصحاب العمل.
FinTech Foundations and Overview
Our primary goal is to help you to understand FinTech and to become more confident and persuasive in your ability to analyze and make recommendations to executives within the finance industry regarding how to react to these changes.
This FIRST MOOC ON FINTECH IN ASIA-PACIFIC offered by HKUST presents the insight of several professors from the top business school in Asia as well as perspectives from industry professionals. HKUST has been ranked for many years as the No.1 EMBA program in the world, as the number one Finance program in Asia, and as the top MBA program in Asia by multiple independent rating and review journals and surveys.
This course "FinTech Foundations and Overview" offers the combined strengths of HKUST in Business, Finance, and Technology as one the world's leading academic institutions on an important area of technology and business innovations. For learners from outside Asia, this also gives an insight into changes happening in the most advanced FinTech markets of the world, since Asia leads worldwide in FinTech adoption and creative innovations.
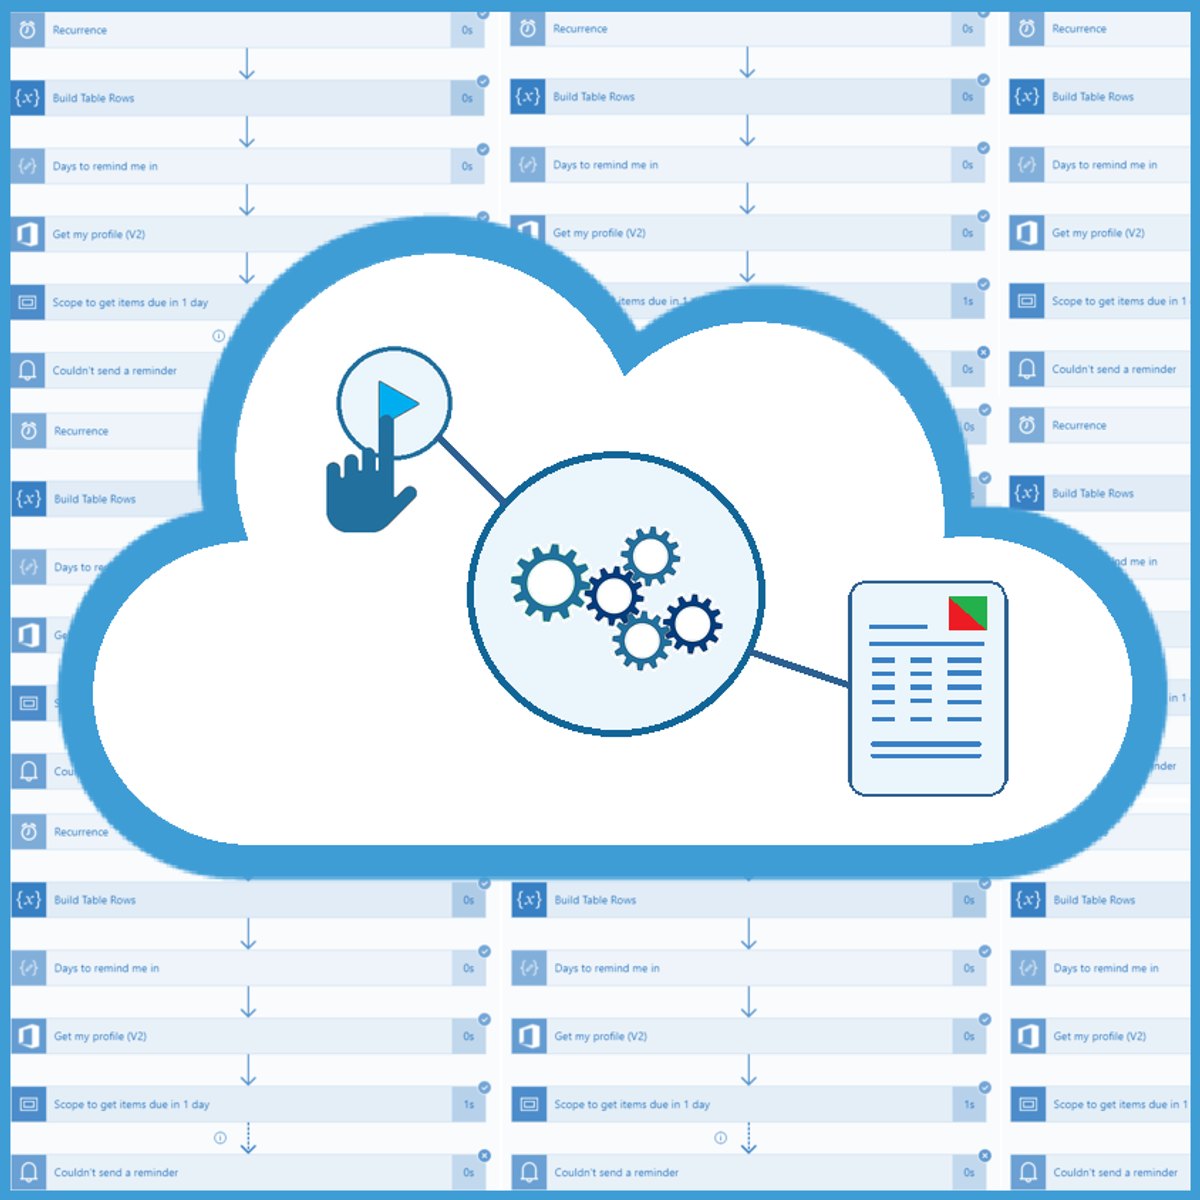
Automize Monthly Report Creation with Power Automate
Imagine you're working in a large company and part of your job is to send reports to other departments about employee absence from work in the past month. Basically, it is a repetitive and boring manual task that repeats every month and takes a lot of your time. However, you can easily automate it with SharePoint and Power Automate!
In this beginner-level guided project "Automize Monthly Report Creation with Power Automate", we will create a SharePoint Site and a SharePoint list with data about employees' annual leave days, sick leave days or days off. All the data will be kept in one place. That data will help us to create the Monthly Employee Absence Report. The Power Automate flow will export data from the SharePoint list and save it in an Excel spreadsheet. Then we will send the table (the report) in an email as an Excel table.
The requirement for this project is having a Microsoft Developer Program account, and you will be provided with instructions on how to get it right here.
If you are ready to make your and your colleagues’ lives easier by starting to automate manual, time-consuming processes which are hard to track, then this project is for you! Let's get started!
Introduction to Microsoft Excel
By the end of this project, you will learn how to create an Excel Spreadsheet by using a free version of Microsoft Office Excel.
Excel is a spreadsheet that works like a database. It consists of individual cells that can be used to build functions, formulas, tables, and graphs that easily organize and analyze large amounts of information and data. Excel is organized into rows (represented by numbers) and columns (represented by letters) that contain your information. This format allows you to present large amounts of information and data in a concise and easy to follow format. Microsoft Excel is the most widely used software within the business community. Whether it is bankers or accountants or business analysts or marketing professionals or scientists or entrepreneurs, almost all professionals use Excel on a consistent basis.
You will learn what an Excel Spreadsheet is, why we use it and the most important keyboard shortcuts, functions, and basic formulas.
Six Sigma Tools for Improve and Control
This course will provide you will the tools necessary to complete the final components of the analyze phase as well as the improve and control phases of the Six Sigma DMAIC (Define, Measure, Analyze, Improve, and Control) process. This course is the final course in the Six Sigma Yellow Belt Specialization. You will learn about relationships from data using correlation and regression as well as the different hypothesis terms in hypothesis testing. This course will provide you with tools and techniques for improvement. You will also understand the importance of a control plan, as well as its key characteristics, for maintaining process improvements. Every module will include readings, discussions, lecture videos, and quizzes to help make sure you understand the material and concepts that are studied.
Our applied curriculum is built around the latest handbook The Certified Six Sigma Handbook (2nd edition) and students will develop /learn the fundamentals of Six Sigma. Registration includes online access to course content, projects, and resources but does not include the companion text The Certified Six Sigma Handbook (2nd edition). The companion text is not required to complete the assignments. However, the text is a recognized handbook used by professionals in the field. Also, it is a highly recommended text for those wishing to move forward in Six Sigma and eventually gain certification from professional agencies such as American Society for Quality (ASQ).
Create and Design Digital Products using Canva
By the end of this course, you will create templates for digital products that you can sell in the marketplace using Canva. You will be able to incorporate a color scheme, images, and other design elements for aesthetically pleasing and sellable products. This course will include intermediate to advanced level skills using the free version of Canva. Creating high-quality digital products is the perfect way to showcase your design expertise and build a business without a large investment.
Note: This course works best for learners who are based in the North America region. We’re currently working on providing the same experience in other regions.
GIS Data Formats, Design and Quality
In this course, the second in the Geographic Information Systems (GIS) Specialization, you will go in-depth with common data types (such as raster and vector data), structures, quality and storage during four week-long modules:
Week 1: Learn about data models and formats, including a full understanding of vector data and raster concepts. You will also learn about the implications of a data’s scale and how to load layers from web services.
Week 2: Create a vector data model by using vector attribute tables, writing query strings, defining queries, and adding and calculating fields. You'll also learn how to create new data through the process of digitizing and you'll use the built-in Editor tools in ArcGIS.
Week 3: Learn about common data storage mechanisms within GIS, including geodatabases and shapefiles. Learn how to choose between them for your projects and how to optimize them for speed and size. You'll also work with rasters for the first time, using digital elevation models and creating slope and distance analysis products.
Week 4: Explore datasets and assess them for quality and uncertainty. You will also learn how to bring your maps and data to the Internet and create web maps quickly with ArcGIS Online.
Take GIS Data Formats, Design and Quality as a standalone course or as part of the Geographic Information Systems (GIS) Specialization. You should have equivalent experience to completing the first course in this specialization, Fundamentals of GIS, before taking this course. By completing the second class in the Specialization you will gain the skills needed to succeed in the full program.
Popular Internships and Jobs by Categories
Find Jobs & Internships
Browse


© 2024 BoostGrad | All rights reserved