Back to Courses







Data Analysis Courses - Page 86
Showing results 851-860 of 998

Predict Gas Guzzlers using a Neural Net Model on the MPG Data Set
In this 1-hour long project-based course, you will learn how to (complete a training and test set using an R function, practice looking at data distribution using R and ggplot2, Apply a Neural Net model to the data, and examine the results using a Confusion Matrix.
Note: This course works best for learners who are based in the North America region. We’re currently working on providing the same experience in other regions.

Data Analytics Methods for Marketing
This course explores common analytics methods used by marketers. You’ll learn how to define a target audience using segmentation with K-means clustering. You’ll also explore how linear regression can help marketers plan and forecast. You’ll learn to evaluate the effectiveness of advertising using experiments as well as observational methods and you’ll explore methods to optimize your marketing mix; marketing mix modeling and attribution. Finally, you’ll learn to evaluate sales funnel shapes, visualize and optimize them.
By the end of this course you will be able to:
• Describe when analytics is most commonly used in marketing
• Understand your audience using analytics and variable descriptions
• Segment a population into different audiences using cluster analysis
• Use historical data to plan your marketing across different channels
• Use linear regression to forecast marketing outcomes
• Describe marketing mix modeling
• Describe attribution modeling
• Apply different attribution models
• Evaluate advertising effectiveness and describe the shortcomings
• Describe the use of experiments to evaluate advertising effectiveness
• Explain how A/B testing works and how you can use it to optimize ads
• Evaluate results of an experiment and assess the strength of the experiment
• Evaluate and optimize your sales funnel
This course is for people who want to learn how to plan and forecast marketing efforts as well as evaluate marketing methods and sales funnels for optimization.
Learners don't need marketing or data analysis experience, but should have basic internet navigation skills and be eager to participate. Ideally learners have already completed course 1 (Marketing Analytics Foundation), course 2 (Introduction to Data Analytics), and course 3 (Statistics for Marketing) in this program.

Data Mining Project
Note: You should complete all the other courses in this Specialization before beginning this course.
This six-week long Project course of the Data Mining Specialization will allow you to apply the learned algorithms and techniques for data mining from the previous courses in the Specialization, including Pattern Discovery, Clustering, Text Retrieval, Text Mining, and Visualization, to solve interesting real-world data mining challenges. Specifically, you will work on a restaurant review data set from Yelp and use all the knowledge and skills you’ve learned from the previous courses to mine this data set to discover interesting and useful knowledge. The design of the Project emphasizes: 1) simulating the workflow of a data miner in a real job setting; 2) integrating different mining techniques covered in multiple individual courses; 3) experimenting with different ways to solve a problem to deepen your understanding of techniques; and 4) allowing you to propose and explore your own ideas creatively.
The goal of the Project is to analyze and mine a large Yelp review data set to discover useful knowledge to help people make decisions in dining. The project will include the following outputs:
1. Opinion visualization: explore and visualize the review content to understand what people have said in those reviews.
2. Cuisine map construction: mine the data set to understand the landscape of different types of cuisines and their similarities.
3. Discovery of popular dishes for a cuisine: mine the data set to discover the common/popular dishes of a particular cuisine.
4. Recommendation of restaurants to help people decide where to dine: mine the data set to rank restaurants for a specific dish and predict the hygiene condition of a restaurant.
From the perspective of users, a cuisine map can help them understand what cuisines are there and see the big picture of all kinds of cuisines and their relations. Once they decide what cuisine to try, they would be interested in knowing what the popular dishes of that cuisine are and decide what dishes to have. Finally, they will need to choose a restaurant. Thus, recommending restaurants based on a particular dish would be useful. Moreover, predicting the hygiene condition of a restaurant would also be helpful.
By working on these tasks, you will gain experience with a typical workflow in data mining that includes data preprocessing, data exploration, data analysis, improvement of analysis methods, and presentation of results. You will have an opportunity to combine multiple algorithms from different courses to complete a relatively complicated mining task and experiment with different ways to solve a problem to understand the best way to solve it. We will suggest specific approaches, but you are highly encouraged to explore your own ideas since open exploration is, by design, a goal of the Project.
You are required to submit a brief report for each of the tasks for peer grading. A final consolidated report is also required, which will be peer-graded.

Python Project for Data Science
This mini-course is intended to for you to demonstrate foundational Python skills for working with data. The completion of this course involves working on a hands-on project where you will develop a simple dashboard using Python.
This course is part of the IBM Data Science Professional Certificate and the IBM Data Analytics Professional Certificate.
PRE-REQUISITE: **Python for Data Science, AI and Development** course from IBM is a pre-requisite for this project course. Please ensure that before taking this course you have either completed the Python for Data Science, AI and Development course from IBM or have equivalent proficiency in working with Python and data.
NOTE: This course is not intended to teach you Python and does not have too much instructional content. It is intended for you to apply prior Python knowledge.

Tesla Stock Price Prediction using Facebook Prophet
In this 1.5-hour long project-based course, you will learn how to build a Facebook Prophet Machine learning model in order to forecast the price of Tesla 30 days into the future. We will also visualize the historical performance of Tesla through graphs and charts using Plotly express and evaluate the performance of the model against real data using Google Finance in Google Sheets. We will also dive into a brief stock analysis of Tesla and we will discuss PE ratio, EPS, Beta, Market cap, Volume and price range of Tesla. We will end the project by automating the forecasting process in such a way that you will get the forecast of any of your favourite stock with all necessary visualization within a few seconds of uploading the data. By the end of this project, you will be confident in analyzing, visualizing and forecasting the price of any stock of your choice.
Disclaimer: This project is intended for educational purpose only and is by no means a piece of Financial advice. Please consult your financial advisor before investing in stocks.
Note: This course works best for learners who are based in the North America region. We’re currently working on providing the same experience in other regions.
Structured Query Language (SQL) using SAS
Course Description
In this course, you learn about Structured Query Language (SQL) and how it can be used in SAS programs to create reports and query your data.
“By the end of this course, a learner will be able to…”
● Query and subset data.
● Summarize and present data.
● Combine tables using joins and set operators.
● Create and modify tables and views.
● Create data-driven macro variables using a query.
● Access DBMS data with SAS/ACCESS technology.

Building Candlestick Charts with Tableau
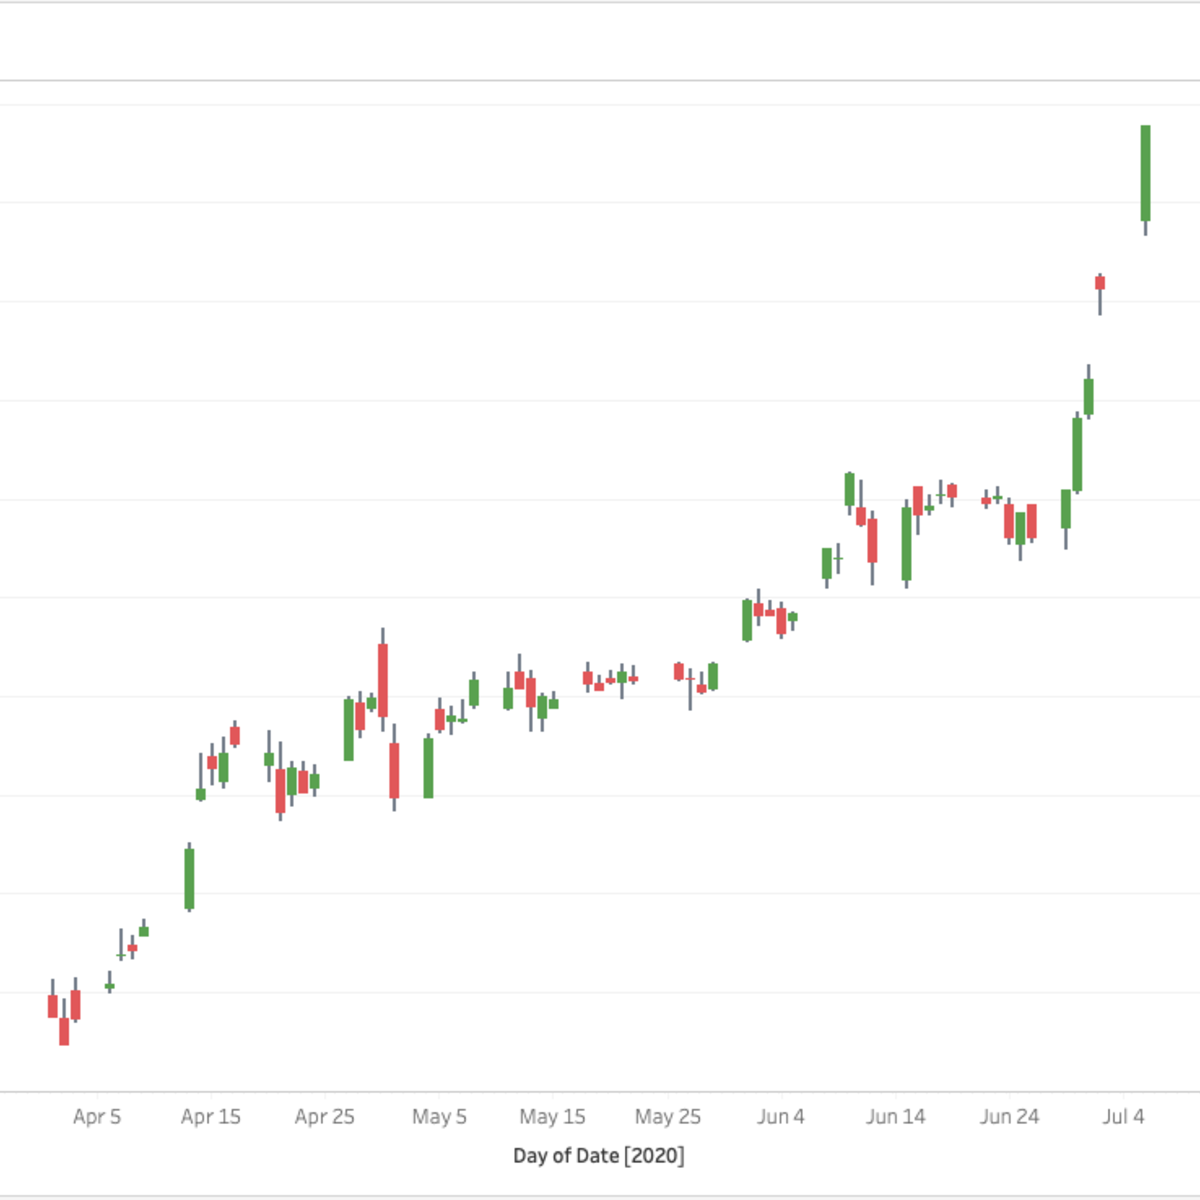
In this 1-hour long project-based course, you will learn how to use Python YFinance to extract stock price data and how to use Tableau to build a japanese candlestick chart.
Note: This course works best for learners who are based in the North America region. We're currently working on providing the same experience in other regions.
This course's content is not intended to be investment advice and does not constitute an offer to perform any operations in the regulated or unregulated financial market

Analyze Sales Data with LibreOffice Base Queries
By the end of this project, you will have developed LibreOffice Base queries that provide data for use in sales analysis. An organization that sells products or services finds it useful to know which products are selling, whether they are priced appropriately, and which customers are purchasing them. Providing that kind of data gives the organization better targets for fine tuning its product mix and customer base.
Note: This course works best for learners who are based in the North America region. We’re currently working on providing the same experience in other regions.

Deep Learning Inference with Azure ML Studio
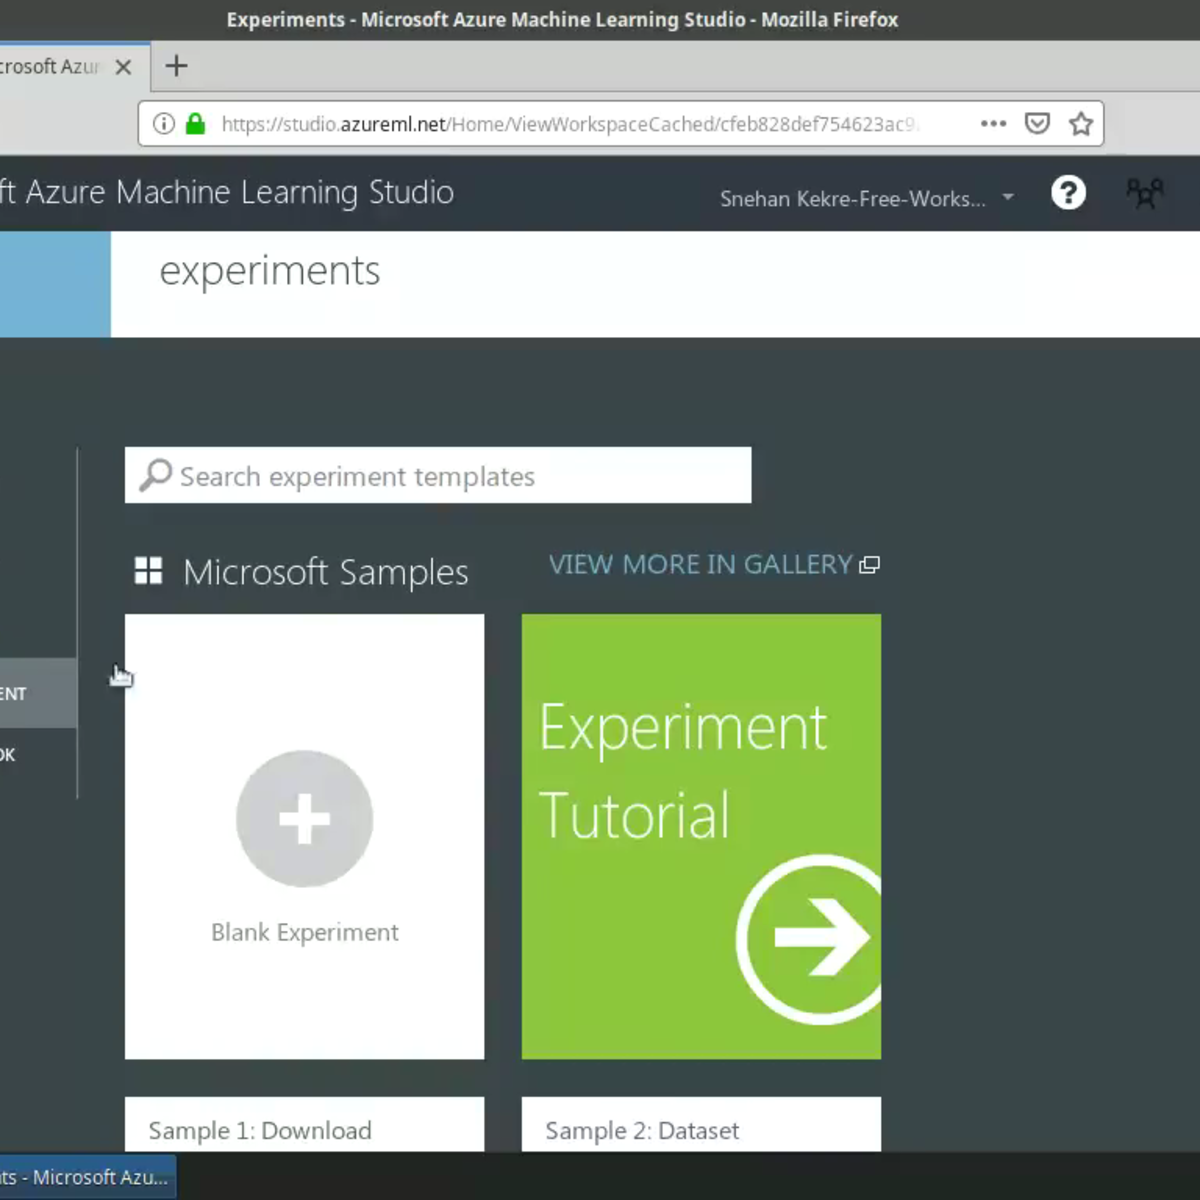
In this project-based course, you will use the Multiclass Neural Network module in Azure Machine Learning Studio to train a neural network to recognize handwritten digits. Microsoft Azure Machine Learning Studio is a drag-and-drop tool you can use to rapidly build and deploy machine learning models on Azure. The data used in this course is the popular MNIST data set consisting of 70,000 grayscale images of hand-written digits. You are going to deploy the trained neural network model as an Azure Web service. Azure Web Services provide an interface between an application and a Machine Learning Studio workflow scoring model. You will write a Python application to use the Batch Execution Service and predict the class labels of handwritten digits.
This is the third course in this series on building machine learning applications using Azure Machine Learning Studio. I highly encourage you to take the first course before proceeding. It has instructions on how to set up your Azure ML account with $200 worth of free credit to get started with running your experiments!
This course runs on Coursera's hands-on project platform called Rhyme. On Rhyme, you do projects in a hands-on manner in your browser. You will get instant access to pre-configured cloud desktops containing all of the software and data you need for the project. Everything is already set up directly in your internet browser so you can just focus on learning. For this project, you’ll get instant access to a cloud desktop with Python, Jupyter, and scikit-learn pre-installed.
Notes:
- You will be able to access the cloud desktop 5 times. However, you will be able to access instructions videos as many times as you want.
- This course works best for learners who are based in the North America region. We’re currently working on providing the same experience in other regions.

SQL for Data Science
As data collection has increased exponentially, so has the need for people skilled at using and interacting with data; to be able to think critically, and provide insights to make better decisions and optimize their businesses. This is a data scientist, “part mathematician, part computer scientist, and part trend spotter” (SAS Institute, Inc.). According to Glassdoor, being a data scientist is the best job in America; with a median base salary of $110,000 and thousands of job openings at a time. The skills necessary to be a good data scientist include being able to retrieve and work with data, and to do that you need to be well versed in SQL, the standard language for communicating with database systems.
This course is designed to give you a primer in the fundamentals of SQL and working with data so that you can begin analyzing it for data science purposes. You will begin to ask the right questions and come up with good answers to deliver valuable insights for your organization. This course starts with the basics and assumes you do not have any knowledge or skills in SQL. It will build on that foundation and gradually have you write both simple and complex queries to help you select data from tables. You'll start to work with different types of data like strings and numbers and discuss methods to filter and pare down your results.
You will create new tables and be able to move data into them. You will learn common operators and how to combine the data. You will use case statements and concepts like data governance and profiling. You will discuss topics on data, and practice using real-world programming assignments. You will interpret the structure, meaning, and relationships in source data and use SQL as a professional to shape your data for targeted analysis purposes.
Although we do not have any specific prerequisites or software requirements to take this course, a simple text editor is recommended for the final project. So what are you waiting for? This is your first step in landing a job in the best occupation in the US and soon the world!
Popular Internships and Jobs by Categories
Browse
© 2024 BoostGrad | All rights reserved


