Back to Courses




Data Analysis Courses - Page 81
Showing results 801-810 of 998

Ingesting FHIR Data with the Healthcare API
This is a self-paced lab that takes place in the Google Cloud console. In this lab you will learn the basic functionalities of Cloud Healthcare API using the Fast Healthcare Interoperability (FHIR) data model.

Data Visualization in Microsoft PowerPoint
By the end of this project, you will create a free account on Microsoft 365, you will get access to Microsoft PowerPoint, and you will create a presentation with data that will be efficiently visualized. Your new skills will help you create a presentation that demonstrates data in the most efficient way.
Applying Data Analytics in Marketing
This course introduces students to marketing analytics through a wide range of analytical tools and approaches. We will discuss causal analysis, survey analysis using regression, textual analysis (sentiment analysis), and network analysis. This course aims to provide the foundation required to make better marketing decisions by analyzing multiple types of data related to customer satisfaction.

Two Stage Production System Optimization With R lpSolveAPI
Two Stage Production System Optimization With R lpSolveAPI

Modelling with WARP PLS
In this 1-hour long project-based course, you will learn how to create path models using Smartpls. We will take a project on changing behavior and check if attitudes or subjective norms impact behavior the most.
We will learn how to launch this new software, create the model and run it. We will then show you how to interpret the same. We will also learn how to create models for different groups such as males and females and if there is a difference between them.
Note: This course works best for learners who are based in the North America region. We’re currently working on providing the same experience in other regions.

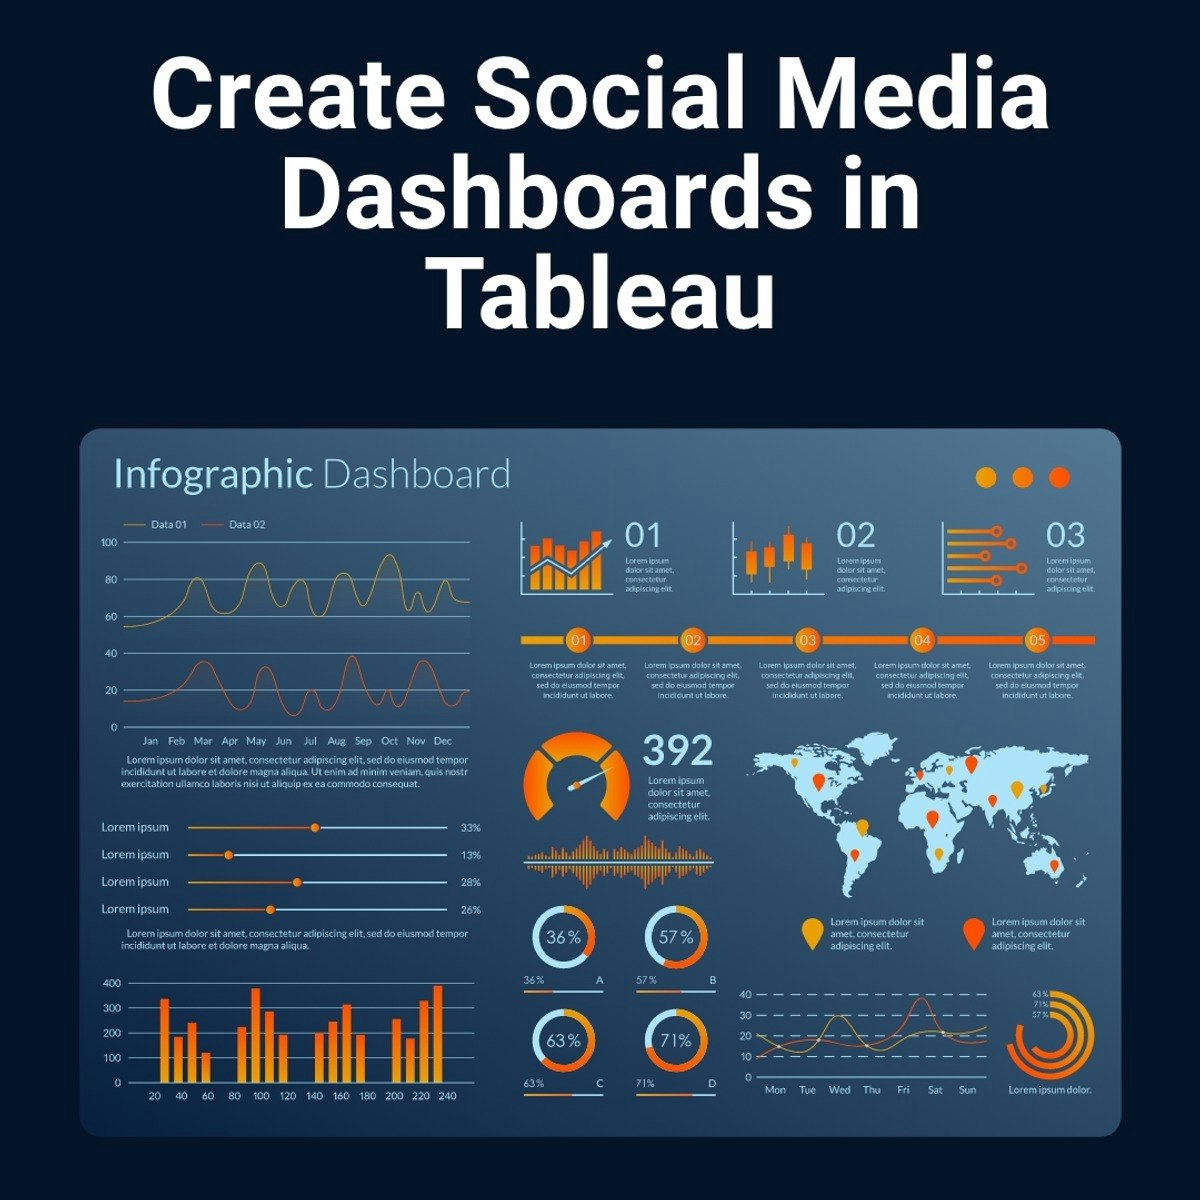
Create Social Media Dashboards in Tableau
Social Media has fundamentally changed how we think about marketing. Brands of all sizes are using social media to not only grow a following but to learn more about what our target audience(s) are interested in. As social media advertising is growing by leaps and bounds, it’s important to understand which ads are working and which ones need some more attention. Learning how to visualize this data can make it easier to make decisions about what to do next.
In this course, learners will learn how to create an account, how to do some basic data cleaning, and how to upload data to Tableau. Learners will also learn how to create big number visualizations, tables, word charts, and bubble charts. Finally, learners will combine these visualizations into dashboards.
The ideal learner for this project will be someone who is making decisions about social media. They should be somewhat familiar with social media terms and general practices.
Analyze Data
This course is designed for business professionals that want to learn how to analyze data to gain insight, use statistical analysis methods to explore the underlying distribution of data, use visualizations such as histograms, scatter plots, and maps to analyze data and preprocess data to produce a dataset ready for training.
The typical student in this course will have several years of experience with computing technology, including some aptitude in computer programming.

Build Random Forests in R with Azure ML Studio
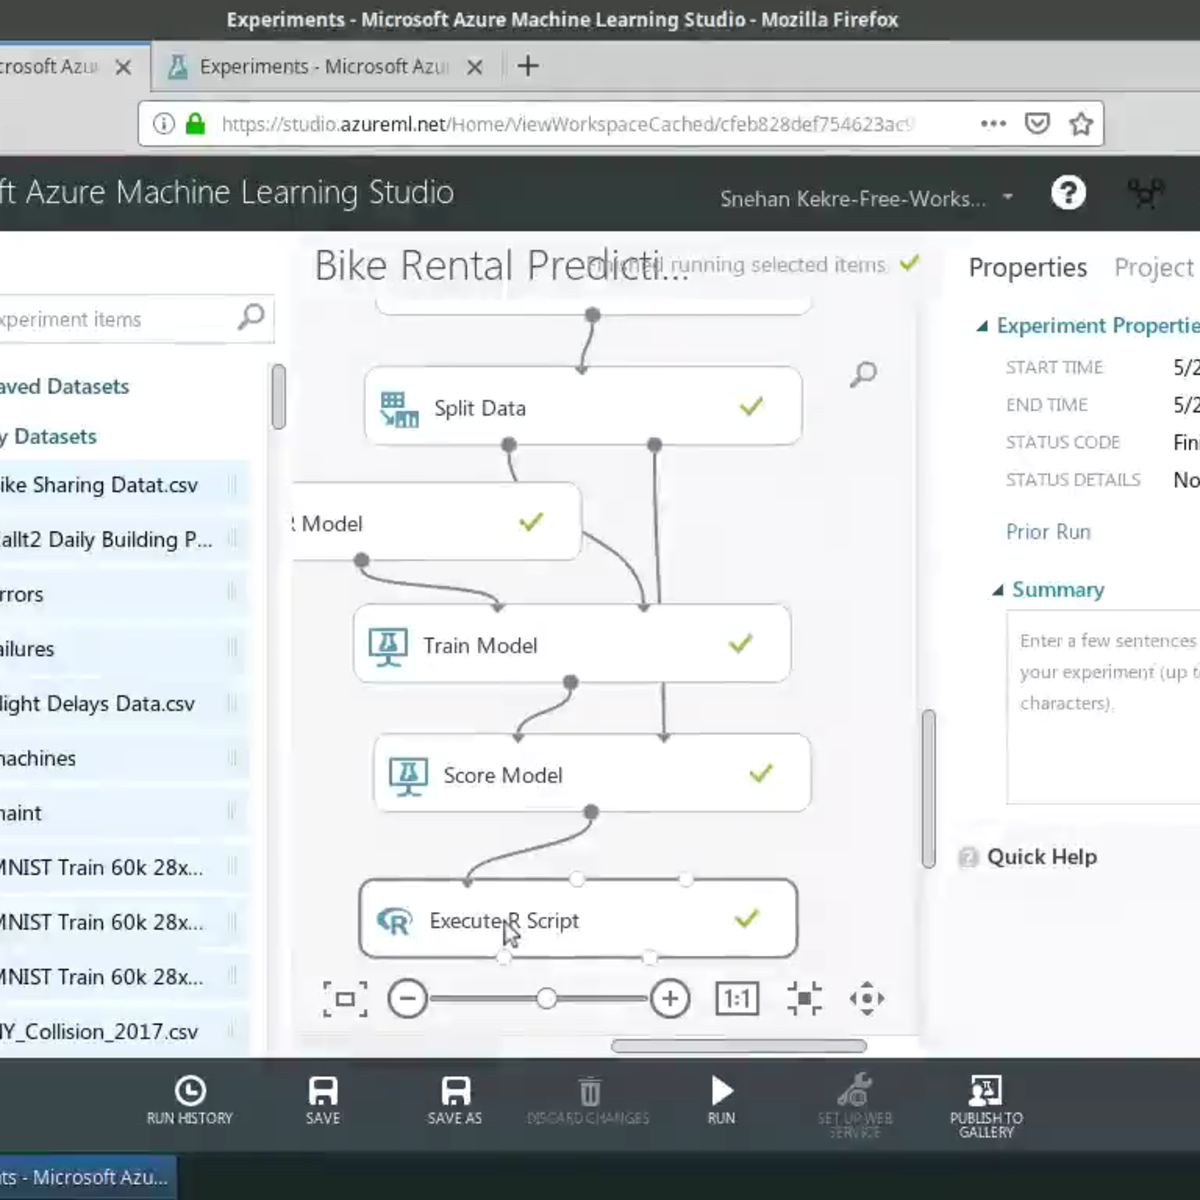
In this project-based course you will learn to perform feature engineering and create custom R models on Azure ML Studio, all without writing a single line of code! You will build a Random Forests model in Azure ML Studio using the R programming language. The data to be used in this course is the Bike Sharing Dataset. The dataset contains the hourly and daily count of rental bikes between years 2011 and 2012 in Capital bikeshare system with the corresponding weather and seasonal information. Using the information from the dataset, you can build a model to predict the number of bikes rented during certain weather conditions. You will leverage the Execute R Script and Create R Model modules to run R scripts from the Azure ML Studio experiment perform feature engineering.
This is the fourth course in this series on building machine learning applications using Azure Machine Learning Studio. I highly encourage you to take the first course before proceeding. It has instructions on how to set up your Azure ML account with $200 worth of free credit to get started with running your experiments!
This course runs on Coursera's hands-on project platform called Rhyme. On Rhyme, you do projects in a hands-on manner in your browser. You will get instant access to pre-configured cloud desktops containing all of the software and data you need for the project. Everything is already set up directly in your internet browser so you can just focus on learning. For this project, you’ll get instant access to a cloud desktop with Python, Jupyter, and scikit-learn pre-installed.
Notes:
- You will be able to access the cloud desktop 5 times. However, you will be able to access instructions videos as many times as you want.
- This course works best for learners who are based in the North America region. We’re currently working on providing the same experience in other regions.

Data Science Project: MATLAB for the Real World
Like most subjects, practice makes perfect in Data Science. In the capstone project, you will apply the skills learned across courses in the Practical Data Science with MATLAB specialization to explore, process, analyze, and model data. You will choose your own pathway to answer key questions with the provided data.
To complete the project, you must have mastery of the skills covered in other courses in the specialization. The project will test your ability to import and explore your data, prepare the data for analysis, train a predictive model, evaluate and improve your model, and communicate your results.
Infonomics II: Business Information Management and Measurement
Even decades into the Information Age, accounting practices yet fail to recognize the financial value of information. Moreover, traditional asset management practices fail to recognize information as an asset to be managed with earnest discipline. This has led to a business culture of complacence, and the inability for most organizations to fully leverage available information assets.
This second course in the two-part Infonomics series explores how and why to adapt well-honed asset management principles and practices to information, and how to apply accepted and new valuation models to gauge information’s potential and realized economic benefits. In addition, the course will enlighten students on the critical but confounding issues of information ownership, property rights, and sovereignty. The course will wrap up with an overview of emergent roles for the information-savvy organization of the 21st century.
Popular Internships and Jobs by Categories
Browse
© 2024 BoostGrad | All rights reserved


