Back to Courses


Data Analysis Courses - Page 8
Showing results 71-80 of 998
Data Science Methodology
If there is a shortcut to becoming a Data Scientist, then learning to think and work like a successful Data Scientist is it. Most of the established data scientists follow a similar methodology for solving Data Science problems. In this course you will learn and then apply this methodology that can be used to tackle any Data Science scenario.
The purpose of this course is to share a methodology that can be used within data science, to ensure that the data used in problem solving is relevant and properly manipulated to address the question at hand.
Accordingly, in this course, you will learn:
- The major steps involved in practicing data science
- Forming a business/research problem, collecting, preparing & analyzing data, building a model,
deploying a model and understanding the importance of feedback
- Apply the 6 stages of the CRISP-DM methodology, the most popular methodology for Data Science and Data Mining problems
- How data scientists think!
To apply the methodology, you will work on a real-world inspired scenario and work with Jupyter Notebooks using Python to develop hands-on experience.
Analyzing Big Data with SQL
In this course, you'll get an in-depth look at the SQL SELECT statement and its main clauses. The course focuses on big data SQL engines Apache Hive and Apache Impala, but most of the information is applicable to SQL with traditional RDBMs as well; the instructor explicitly addresses differences for MySQL and PostgreSQL.
By the end of the course, you will be able to
• explore and navigate databases and tables using different tools;
• understand the basics of SELECT statements;
• understand how and why to filter results;
• explore grouping and aggregation to answer analytic questions;
• work with sorting and limiting results; and
• combine multiple tables in different ways.
To use the hands-on environment for this course, you need to download and install a virtual machine and the software on which to run it. Before continuing, be sure that you have access to a computer that meets the following hardware and software requirements:
• Windows, macOS, or Linux operating system (iPads and Android tablets will not work)
• 64-bit operating system (32-bit operating systems will not work)
• 8 GB RAM or more
• 25GB free disk space or more
• Intel VT-x or AMD-V virtualization support enabled (on Mac computers with Intel processors, this is always enabled;
on Windows and Linux computers, you might need to enable it in the BIOS)
• For Windows XP computers only: You must have an unzip utility such as 7-Zip or WinZip installed (Windows XP’s built-in unzip utility will not work)
Big data and Language 1
In this course, students will understand characteristics of language through big data. Students will learn how to collect and analyze big data, and find linguistic features from the data. A number of approaches to the linguistic analysis of written and spoken texts will be discussed.
The class will consist of lecture videos which are approximately 1 hour and a quiz for each week. There will be a final project which requires students to conduct research on text data and language.
Applied Text Mining in Python
This course will introduce the learner to text mining and text manipulation basics. The course begins with an understanding of how text is handled by python, the structure of text both to the machine and to humans, and an overview of the nltk framework for manipulating text. The second week focuses on common manipulation needs, including regular expressions (searching for text), cleaning text, and preparing text for use by machine learning processes. The third week will apply basic natural language processing methods to text, and demonstrate how text classification is accomplished. The final week will explore more advanced methods for detecting the topics in documents and grouping them by similarity (topic modelling).
This course should be taken after: Introduction to Data Science in Python, Applied Plotting, Charting & Data Representation in Python, and Applied Machine Learning in Python.
Regression Models
Linear models, as their name implies, relates an outcome to a set of predictors of interest using linear assumptions. Regression models, a subset of linear models, are the most important statistical analysis tool in a data scientist’s toolkit. This course covers regression analysis, least squares and inference using regression models. Special cases of the regression model, ANOVA and ANCOVA will be covered as well. Analysis of residuals and variability will be investigated. The course will cover modern thinking on model selection and novel uses of regression models including scatterplot smoothing.
Modeling Data in the Tidyverse
Developing insights about your organization, business, or research project depends on effective modeling and analysis of the data you collect. Building effective models requires understanding the different types of questions you can ask and how to map those questions to your data. Different modeling approaches can be chosen to detect interesting patterns in the data and identify hidden relationships.
This course covers the types of questions you can ask of data and the various modeling approaches that you can apply. Topics covered include hypothesis testing, linear regression, nonlinear modeling, and machine learning. With this collection of tools at your disposal, as well as the techniques learned in the other courses in this specialization, you will be able to make key discoveries from your data for improving decision-making throughout your organization.
In this specialization we assume familiarity with the R programming language. If you are not yet familiar with R, we suggest you first complete R Programming before returning to complete this course.
Database Design and Basic SQL in PostgreSQL
In this course you will learn more about the historical design of databases and the use of SQL in the PostgreSQL environment. Using SQL techniques and common commands (INSERT INTO, WHERE, ORDER BY, ON DELETE CASCADE, etc) will enable you to create tables, column types and define the schema of your data in PostgreSQL. You will learn about data modeling and how to represent one-to-many and many-to-many relationships in PostgreSQL. Students will do hands-on assignments creating tables, inserting data, designing data models, creating relational structures and inserting and querying relational data in tables.
Precalculus: Mathematical Modeling
This course helps to build the foundational material to use mathematics as a tool to model, understand, and interpret the world around us. This is done through studying functions, their properties, and applications to data analysis. Concepts of precalculus provide the set of tools for the beginning student to begin their scientific career, preparing them for future science and calculus courses. This course is designed for all students, not just those interested in further mathematics courses. Students interested in the natural sciences, computer sciences, psychology, sociology, or similar will genuinely benefit from this introductory course, applying the skills learned to their discipline to analyze and interpret their subject material. Students will be presented with not only new ideas, but also new applications of an old subject. Real-life data, exercise sets, and regular assessments help to motivate and reinforce the content in this course, leading to learning and mastery.
Data Engineering and Machine Learning using Spark
Organizations need skilled, forward-thinking Big Data practitioners who can apply their business and technical skills to unstructured data such as tweets, posts, pictures, audio files, videos, sensor data, and satellite imagery and more to identify behaviors and preferences of prospects, clients, competitors, and others.
In this short course you'll gain practical skills when you learn how to work with Apache Spark for Data Engineering and Machine Learning (ML) applications. You will work hands-on with Spark MLlib, Spark Structured Streaming, and more to perform extract, transform and load (ETL) tasks as well as Regression, Classification, and Clustering.
The course culminates in a project where you will apply your Spark skills to an ETL for ML workflow use-case.
NOTE: This course requires that you have foundational skills for working with Apache Spark and Jupyter Notebooks. The Introduction to Big Data with Spark and Hadoop course from IBM will equip you with these skills and it is recommended that you have completed that course or similar prior to starting this one.
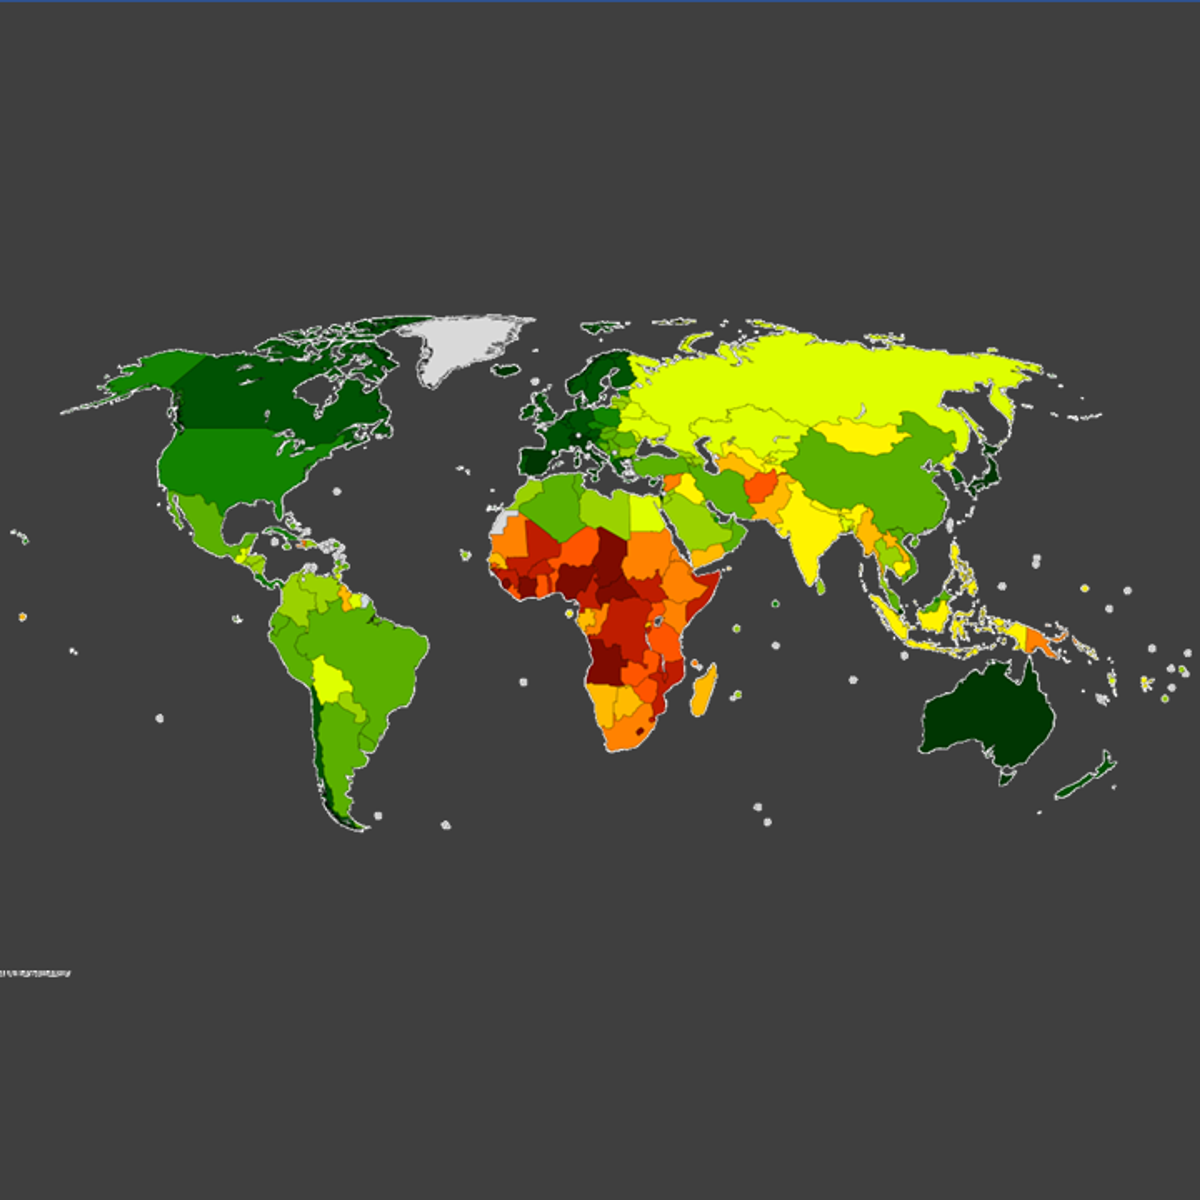
Life Expectancy Prediction Using Machine Learning
In this hands-on project, we will train a Linear Regression model to predict life expectancy. The dataset was initially obtained from the World Health Organization (WHO) and United Nations Websites. Data contains features such as year, status, life expectancy, adult mortality, infant deaths, percentage of expenditure, and alcohol consumption.
Popular Internships and Jobs by Categories
Find Jobs & Internships
Browse


© 2024 BoostGrad | All rights reserved