Back to Courses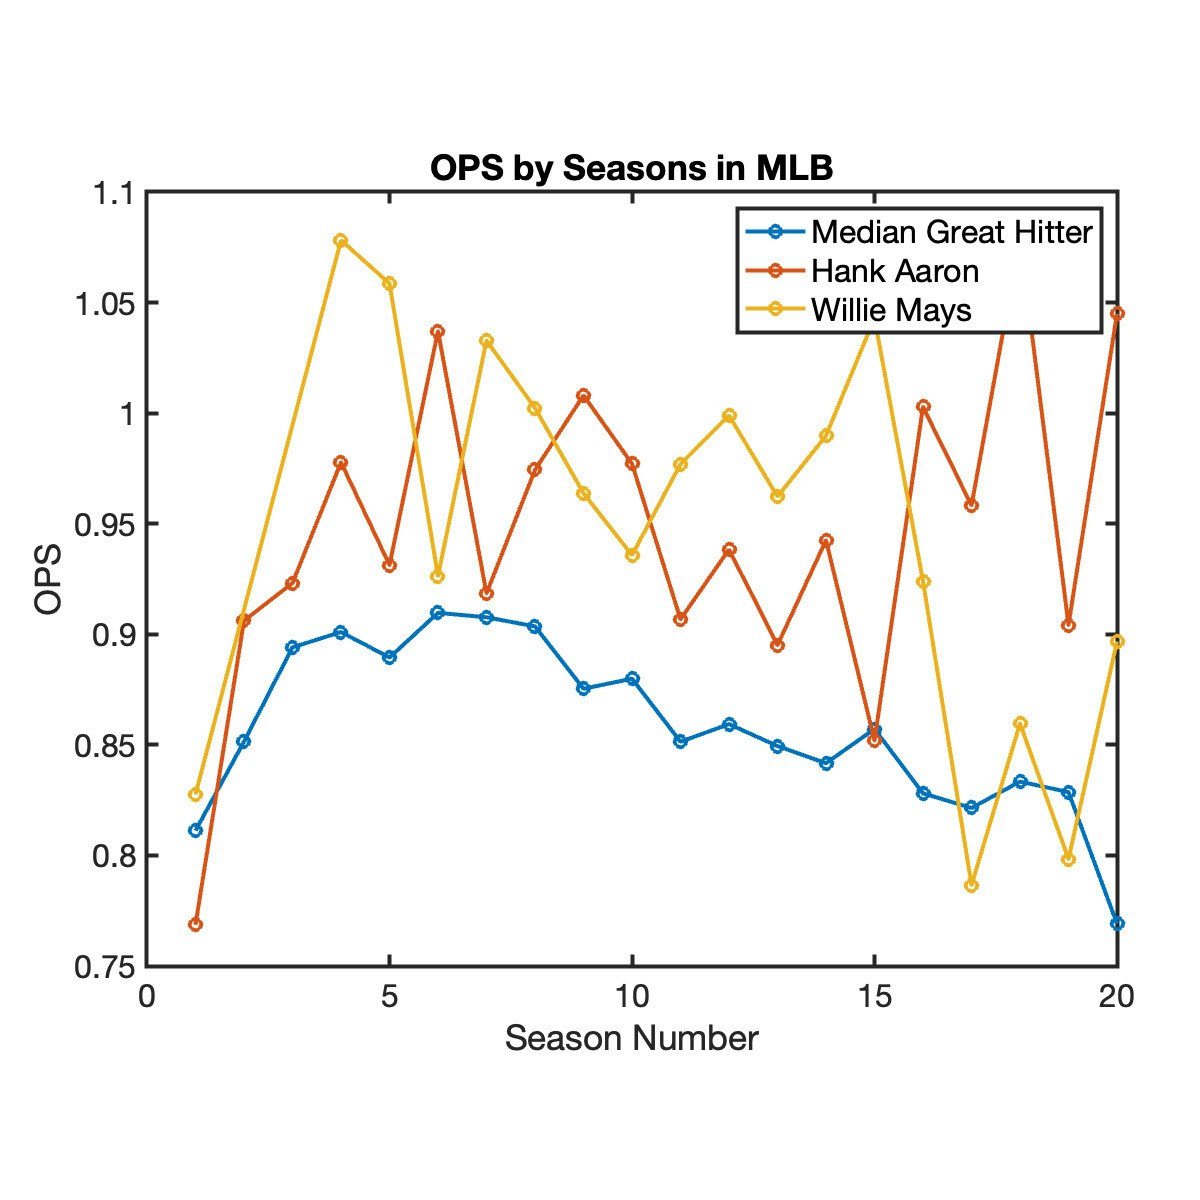





Data Analysis Courses - Page 61
Showing results 601-610 of 998

Take a Swing at Baseball Analytics: Explore Player Careers
Former Major League Baseball (MLB) player Matt Kata joins MathWorks to introduce you to data analysis using baseball statistics. By analyzing historic batting statistics, you will explore player careers and answer the question: When do great hitters peak in their career?
In this project, you will work in MATLAB, a programming environment used by millions of engineers and scientists, and now MLB players! You’ll have access to pitching, batting, and defensive statistics dating back to 1871, enabling you to explore and answer a wide variety of questions. You will compute statistics like On-base Plus Slugging (OPS), visualize results, and filter data to highlight players that meet criteria you specify, such as the number of home runs.
Whether you’re analyzing sports data, financial markets, or electric engine performance, you can apply the data analysis skills you learn in this project to many other fields and applications. So, step up to the plate and take a swing at MATLAB for data analysis.

Data Visualization in Excel
In an age now driven by "big data", we need to cut through the noise and present key information in a way that can be quickly consumed and acted upon making data visualization an increasingly important skill. Visualizations need to not only present data in an easy to understand and attractive way, but they must also provide context for the data, tell a story, achieving that fine balance between form and function. Excel has many rivals in this space, but it is still an excellent choice, particularly if it's where your data resides. It offers a wealth of tools for creating visualizations other than charts and the chart options available are constantly increasing and improving, so the newer versions now include waterfall charts, sunburst diagrams and even map charts. But what sets Excel apart is its flexibility, it gives us total creative control over our designs so if needed we could produce our own animated custom chart to tell the right story for our data.
Over five weeks we will explore Excel's rich selection of visualization tools using practical case studies as seen through the eyes of Rohan, an environmental analyst. Rohan is required to produce visualizations that will show trends, forecasts, breakdowns and comparisons for a large variety of environmental data sets. As well as utilising the usual chart types he wants to use conditional formats, sparklines, specialised charts and even create his own animated charts and infographics. In some cases, he will also need to prepare the data using pivot tables to drill down and answer very specific questions. We are going to help him achieve all this and present our finished visualizations in attractive reports and dashboards that use tools like slicers and macros for automation and interactivity.
These are the topics we will cover:
Week 1: Dynamic visualizations with conditional formatting, custom number formatting, sparklines and macros
Week 2: Charting techniques for telling the right story
Week 3: Creating specialised and custom charts
Week 4: Summarising and filtering data with pivot tables and pivot charts
Week 5: Creating interactive dashboards in Excel
This is the second course in our Specialization on Data Analytics and Visualization. The first course: Excel Fundamentals for Data Analysis, covers data preparation and cleaning but also teaches some of the prerequisites for this course like tables and named ranges as well as text, lookup and logical functions. To get the most out of this course we would recommend you do the first course or have experience with these topics. In this course we focus on Data Visualization in Excel, join us for this exciting journey.

Data Analytics for Lean Six Sigma
Welcome to this course on Data Analytics for Lean Six Sigma.
In this course you will learn data analytics techniques that are typically useful within Lean Six Sigma improvement projects. At the end of this course you are able to analyse and interpret data gathered within such a project. You will be able to use Minitab to analyse the data. I will also briefly explain what Lean Six Sigma is.
I will emphasize on use of data analytics tools and the interpretation of the outcome. I will use many different examples from actual Lean Six Sigma projects to illustrate all tools. I will not discuss any mathematical background.
The setting we chose for our data example is a Lean Six Sigma improvement project. However data analytics tools are very widely applicable. So you will find that you will learn techniques that you can use in a broader setting apart from improvement projects.
I hope that you enjoy this course and good luck!
Dr. Inez Zwetsloot & the IBIS UvA team

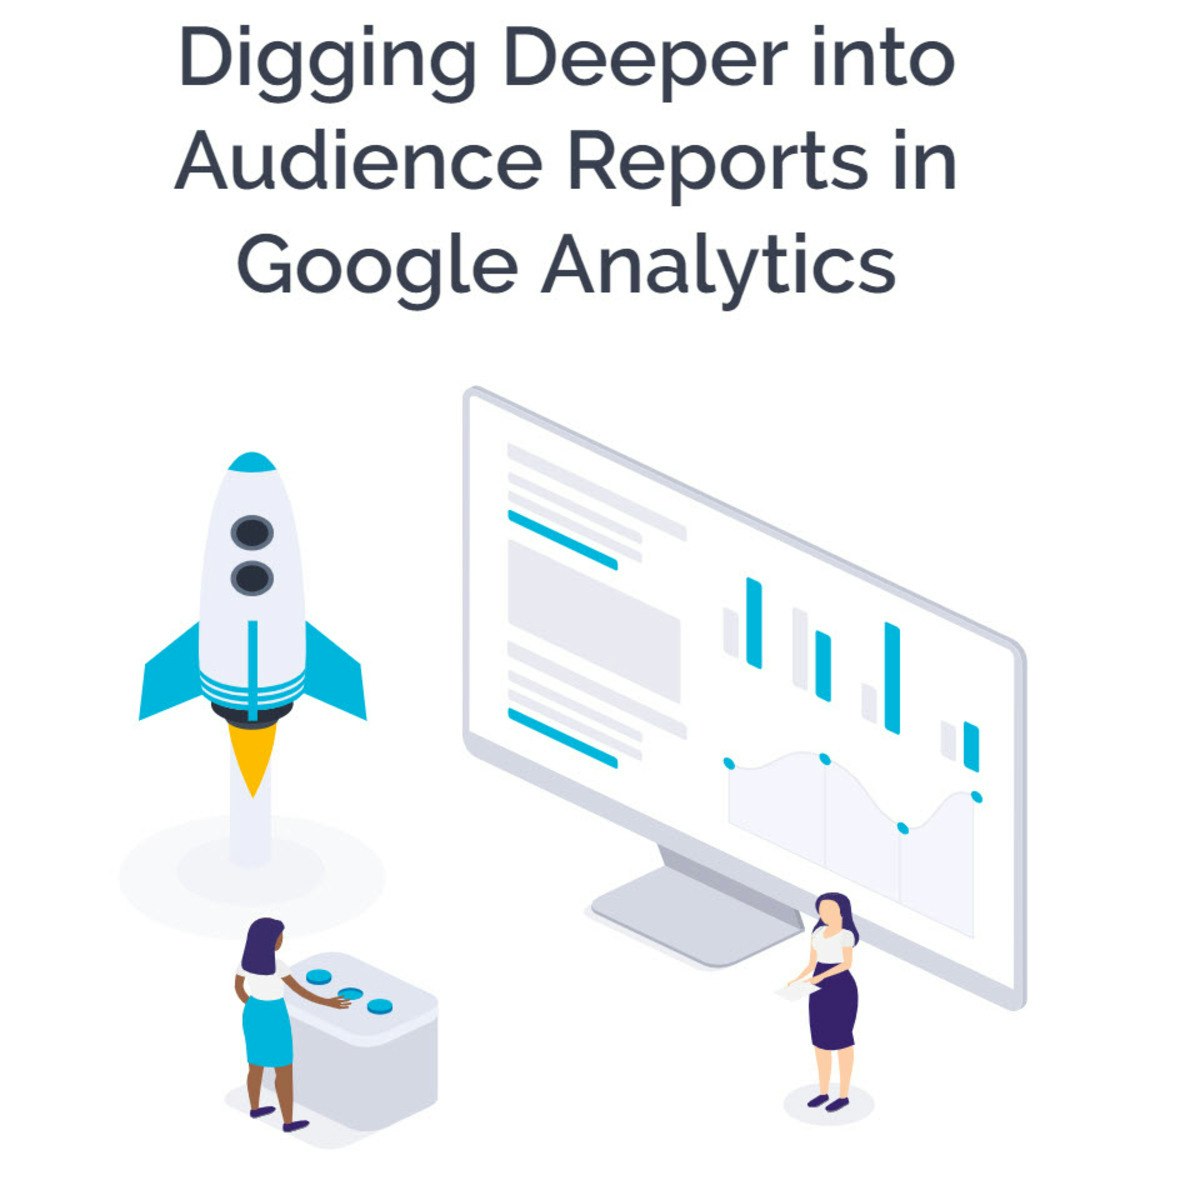
Digging Deeper into Audience Reports in Google Analytics
In this project, you will discover some of the potentially less familiar Audience Reports. You will learn about the Active Users report, the Lifetime Value report, the Cohort Analysis report, the Benchmarking reports and the Users Flow Report. But, even more importantly, you will learn how to use these reports to help you make better decisions when it comes to reaching and engaging your website audience.
Note: This course works best for learners who are based in the North America region. We’re currently working on providing the same experience in other regions.

Cognitive Solutions and RPA Analytics
Millions of companies in the world today are processing endless documents in various formats. Although Robotic Process Automation (RPA) thrives in almost every industry and is growing fast, it works well only with structured data sources.
What about the data that’s not fully structured and comes in varying layouts? To address this problem, there is another aspect of RPA that is taking the industry by storm: cognitive automation.
While implementing RPA, you can deploy automations with “cognitive” capabilities. Cognitive automation uses Artificial Intelligence (AI) to learn and understand the same way the human brain works. Thus, it assists humans in making decisions, completing tasks, or meeting goals. Using cognitive automation, you can extract semi—or unstructured data—which is 80% of all data!
Data is a precious asset. Businesses struggle to make sense of large volumes of available data and to generate a tangible value from them. Manual business processes barely contain any data that is available for capture. This is where Robotic Process Automation (or RPA) Analytics comes in. RPA bots don’t just automate business processes; they also digitize them. They take the large volume of data and interpret it in near real-time to provide actionable information.
In this course, you will be introduced to cognitive automation, the role that AI plays in it, and Automation Anywhere’s cognitive solution, IQ Bot. You will also be introduced to RPA analytics and explore how Automation Anywhere’s Web Control Room and Bot Insight can provide this functionality.
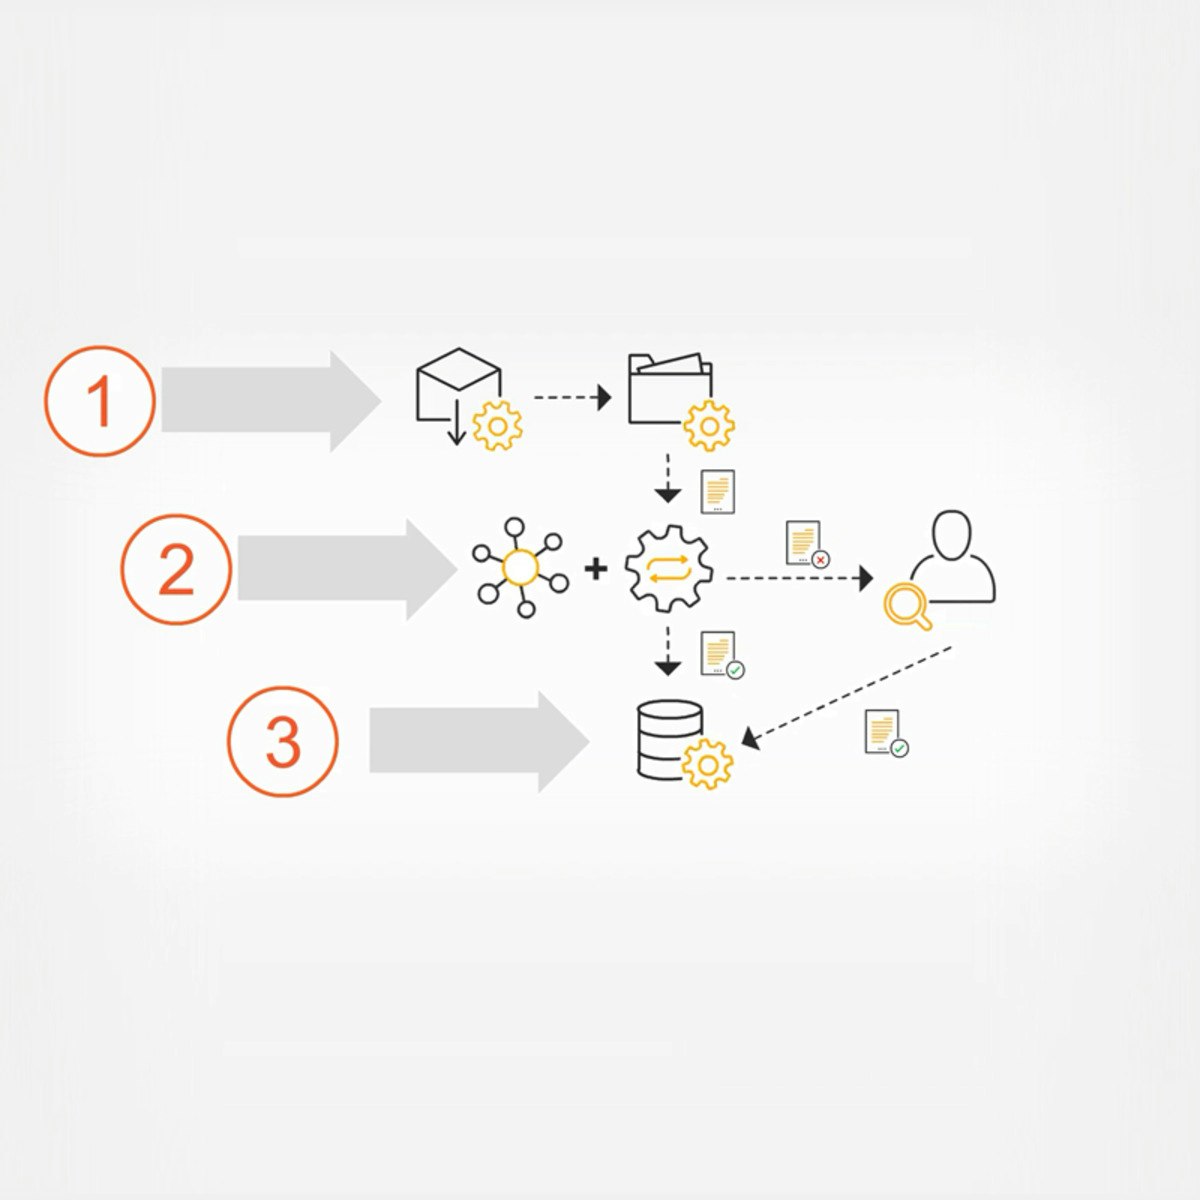
As you begin this course, you will learn the six steps to deploy cognitive automation. Next, you will explore the IQ Bot portal – Automation Anywhere’s web-based application for developing the cognitive IQ bots. You will then learn to use the portal by following the IQ Bot workflow.
Next, you will learn how RPA analytics help interpret and improve automated business processes. You will see how Bot Insight functions as an RPA analytics platform.
You will also explore the different types of RPA analytics and learn how to generate RPA analytics via two mechanisms – the Web Control Room for Operational Analytics and Bot Insight for Business Analytics and CoE Analytics.
Finally, you will learn how to use the RPA mobile app to study and edit the default CoE dashboard that is published via Bot Insight.

Geospatial Data Visualization using Python and Folium
In this project, we are going to learn how to process and analyze geospatial data. we are going to work with a dataset containing information about almost 100 taxis running in Proto, Portugal. We are going to learn how to prepare our data and how to use different geospatial visualization techniques in order to answer some analytical questions. during this project, we will learn how to work with the Folium module in python which is one of the best tools when it comes to geospatial data visualization.

Artificial Intelligence Privacy and Convenience
In this course, we will explore fundamental concepts involved in security and privacy of machine learning projects. Diving into the ethics behind these decisions, we will explore how to protect users from privacy violations while creating useful predictive models. We will also ask big questions about how businesses implement algorithms and how that affects user privacy and transparency now and in the future.

Cluster Analysis in Data Mining
Discover the basic concepts of cluster analysis, and then study a set of typical clustering methodologies, algorithms, and applications. This includes partitioning methods such as k-means, hierarchical methods such as BIRCH, and density-based methods such as DBSCAN/OPTICS. Moreover, learn methods for clustering validation and evaluation of clustering quality. Finally, see examples of cluster analysis in applications.

Social Media Data Analytics
Learner Outcomes: After taking this course, you will be able to:
- Utilize various Application Programming Interface (API) services to collect data from different social media sources such as YouTube, Twitter, and Flickr.
- Process the collected data - primarily structured - using methods involving correlation, regression, and classification to derive insights about the sources and people who generated that data.
- Analyze unstructured data - primarily textual comments - for sentiments expressed in them.
- Use different tools for collecting, analyzing, and exploring social media data for research and development purposes.
Sample Learner Story: Data analyst wanting to leverage social media data.
Isabella is a Data Analyst working as a consultant for a multinational corporation. She has experience working with Web analysis tools as well as marketing data. She wants to now expand into social media arena, trying to leverage the vast amounts of data available through various social media channels. Specifically, she wants to see how their clients, partners, and competitors view their products/services and talk about them. She hopes to build a new workflow of data analytics that incorporates traditional data processing using Web and marketing tools, as well as newer methods of using social media data.
Sample Job Roles requiring these skills:
- Social Media Analyst
- Web Analyst
- Data Analyst
- Marketing and Public Relations
Final Project Deliverable/ Artifact: The course will have a series of small assignments or mini-projects that involve data collection, analysis, and presentation involving various social media sources using the techniques learned in the class.
The course was developed by Dr. Chirag Shah while he was a faculty member at Rutgers University. He is currently a faculty member at University of Washington.
Build Regression, Classification, and Clustering Models
In most cases, the ultimate goal of a machine learning project is to produce a model. Models make decisions, predictions—anything that can help the business understand itself, its customers, and its environment better than a human could. Models are constructed using algorithms, and in the world of machine learning, there are many different algorithms to choose from. You need to know how to select the best algorithm for a given job, and how to use that algorithm to produce a working model that provides value to the business.
This third course within the Certified Artificial Intelligence Practitioner (CAIP) professional certificate introduces you to some of the major machine learning algorithms that are used to solve the two most common supervised problems: regression and classification, and one of the most common unsupervised problems: clustering. You'll build multiple models to address each of these problems using the machine learning workflow you learned about in the previous course.
Ultimately, this course begins a technical exploration of the various machine learning algorithms and how they can be used to build problem-solving models.
Popular Internships and Jobs by Categories
Find Jobs & Internships
Browse
© 2024 BoostGrad | All rights reserved