Back to Courses


Data Analysis Courses - Page 6
Showing results 51-60 of 998
Integral Calculus and Numerical Analysis for Data Science
Are you interested in Data Science but lack the math background for it? Has math always been a tough subject that you tend to avoid? This course will provide an intuitive understanding of foundational integral calculus, including integration by parts, area under a curve, and integral computation. It will also cover root-finding methods, matrix decomposition, and partial derivatives.
This course is designed to prepare learners to successfully complete Statistical Modeling for Data Science Application, which is part of CU Boulder's Master of Science in Data Science (MS-DS) program.
Logo courtesy of ThisisEngineering RAEng on Unsplash.com
The Data Science of Health Informatics
Health data are notable for how many types there are, how complex they are, and how serious it is to get them straight. These data are used for treatment of the patient from whom they derive, but also for other uses. Examples of such secondary use of health data include population health (e.g., who requires more attention), research (e.g., which drug is more effective in practice), quality (e.g., is the institution meeting benchmarks), and translational research (e.g., are new technologies being applied appropriately). By the end of this course, students will recognize the different types of health and healthcare data, will articulate a coherent and complete question, will interpret queries designed for secondary use of EHR data, and will interpret the results of those queries.
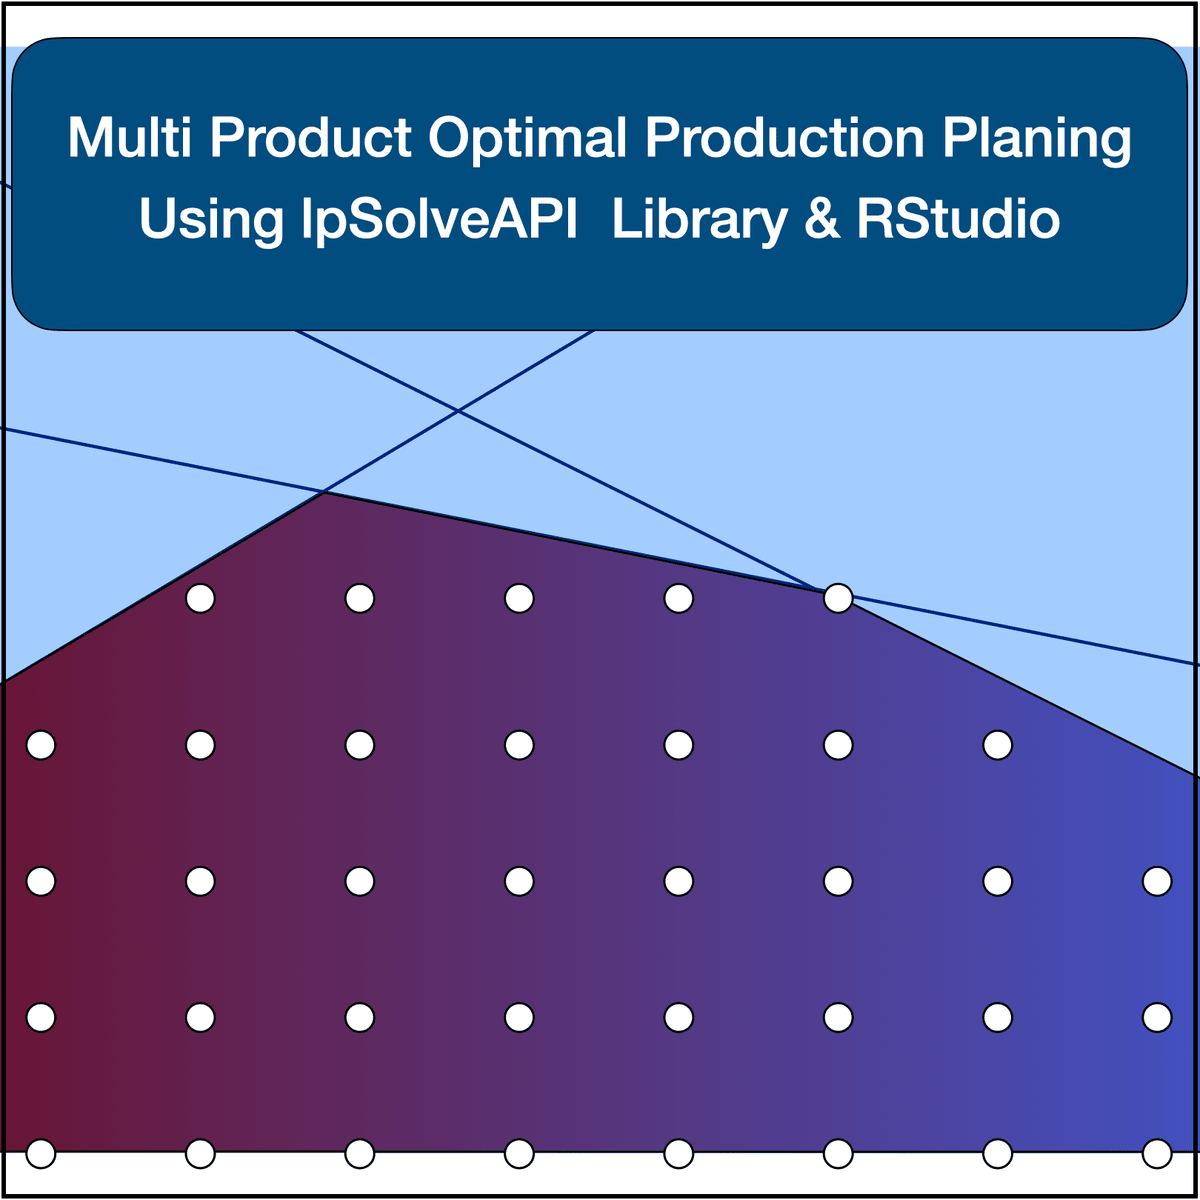
Multi Product Optimal Production Planing Using R lpSolveAPI
For a given demand profile for 8 products over a 9 week period, we determine the optimal production plan for minimal inventory. "Mixed Integer Linear Programming" method is applied using R lpSolve library.
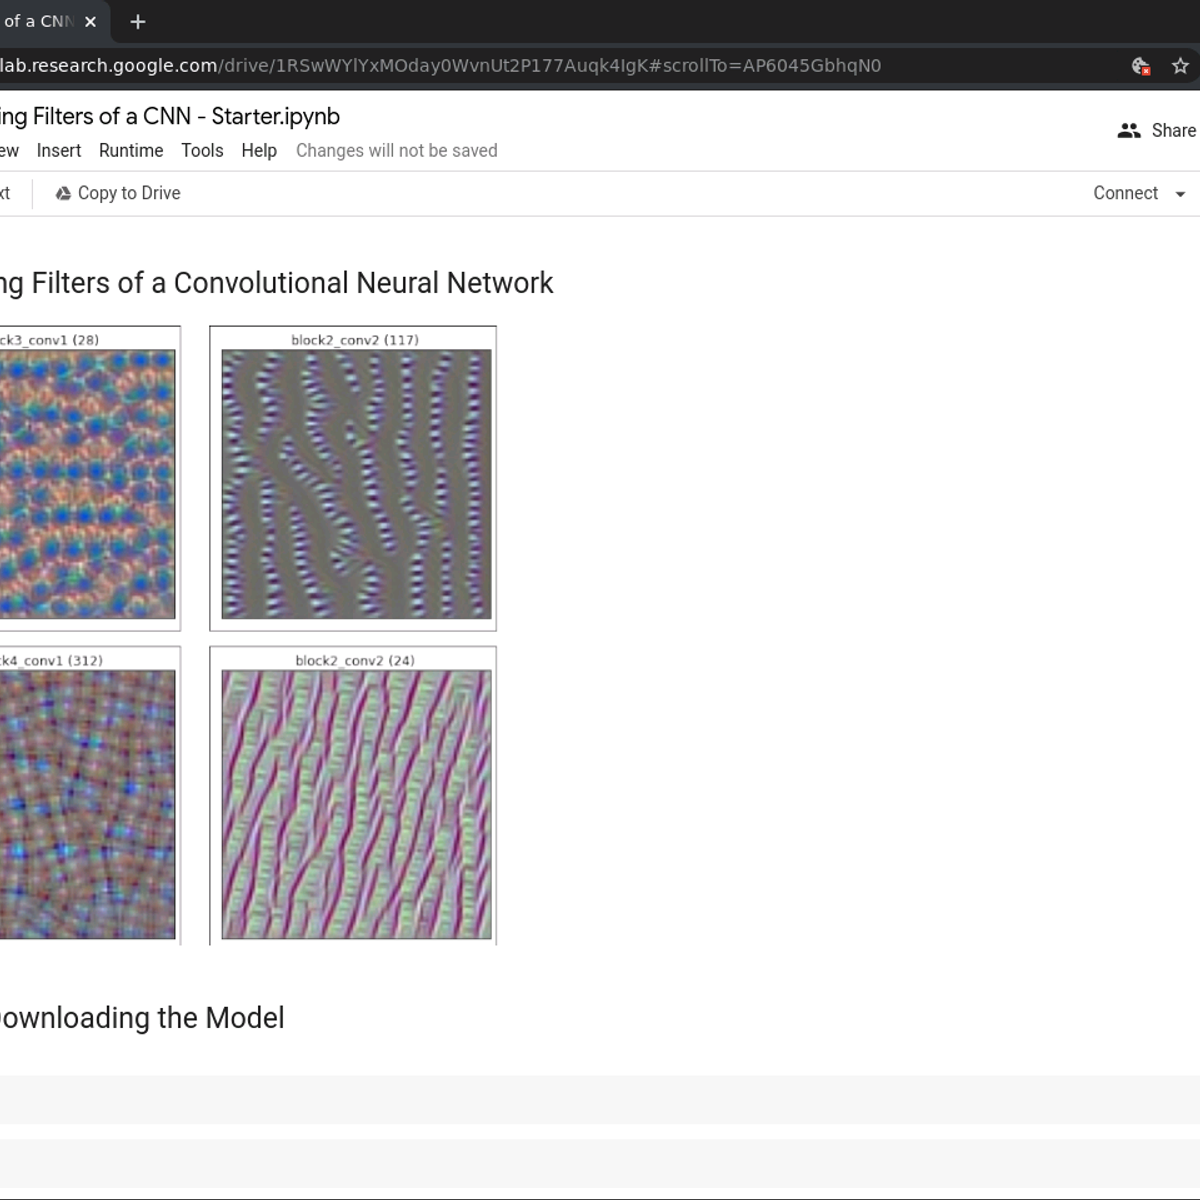
Visualizing Filters of a CNN using TensorFlow
In this short, 1 hour long guided project, we will use a Convolutional Neural Network - the popular VGG16 model, and we will visualize various filters from different layers of the CNN. We will do this by using gradient ascent to visualize images that maximally activate specific filters from different layers of the model.
We will be using TensorFlow as our machine learning framework. The project uses the Google Colab environment which is a fantastic tool for creating and running Jupyter Notebooks in the cloud, and Colab even provides free GPUs for your notebooks.
You will need prior programming experience in Python. This is a practical, hands on guided project for learners who already have theoretical understanding of Neural Networks, Convolutional Neural Networks, and optimization algorithms like gradient descent but want to understand how to use the TensorFlow to visualize various filters of a CNN.
Note: This course works best for learners who are based in the North America region. We’re currently working on providing the same experience in other regions.
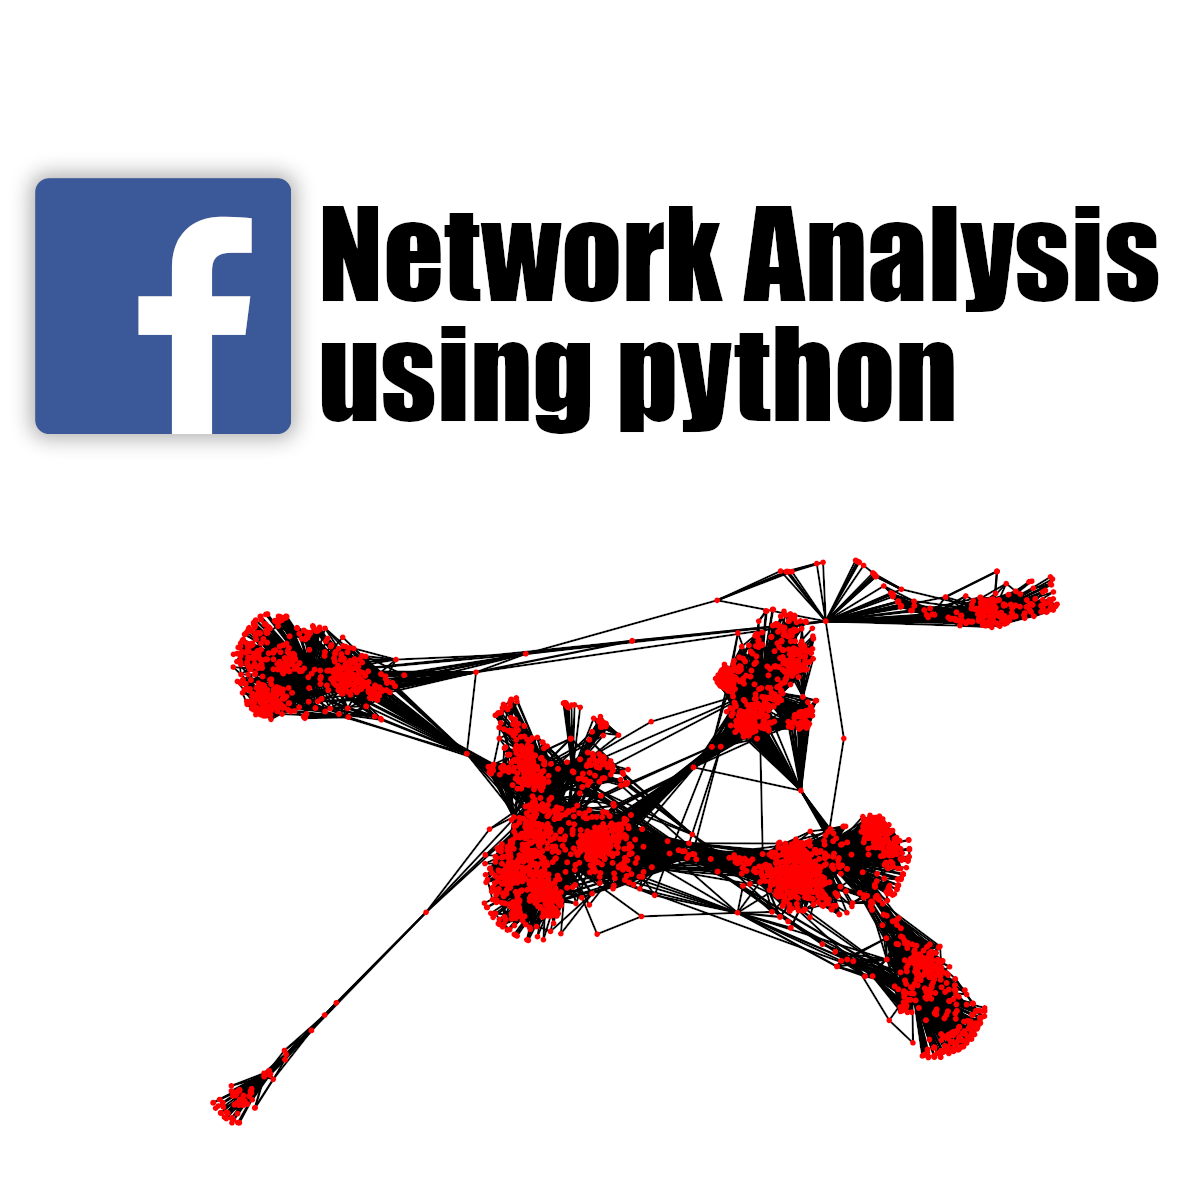
Facebook Network Analysis using Python and Networkx
By the end of this project, you will learn how to Analyze a real network graph using python. you will learn how to use Networkx module to Visualize a graph and to calculate some important measures which can describe characteristics of our graph. you will also learn About Centrality measures to find Important nodes in a graph. In the final task of the project we are going talk about Scale-free networks and we are going to prove that Facebook Network graph has familiarities with Scale-free networks.
Python Project for Data Engineering
This mini-course is intended to apply foundational Python skills by implementing different techniques to collect and work with data. Assume the role of a Data Engineer and extract data from multiple file formats, transform it into specific datatypes, and then load it into a single source for analysis. Continue with the course and test your knowledge by implementing webscraping and extracting data with APIs all with the help of multiple hands-on labs. After completing this course you will have acquired the confidence to begin collecting large datasets from multiple sources and transform them into one primary source, or begin web scraping to gain valuable business insights all with the use of Python.
PRE-REQUISITE: **Python for Data Science, AI and Development** course from IBM is a pre-requisite for this project course. Please ensure that before taking this course you have either completed the Python for Data Science, AI and Development course from IBM or have equivalent proficiency in working with Python and data.
NOTE: This course is not intended to teach you Python and does not have too much instructional content. It is intended for you to apply prior Python knowledge.
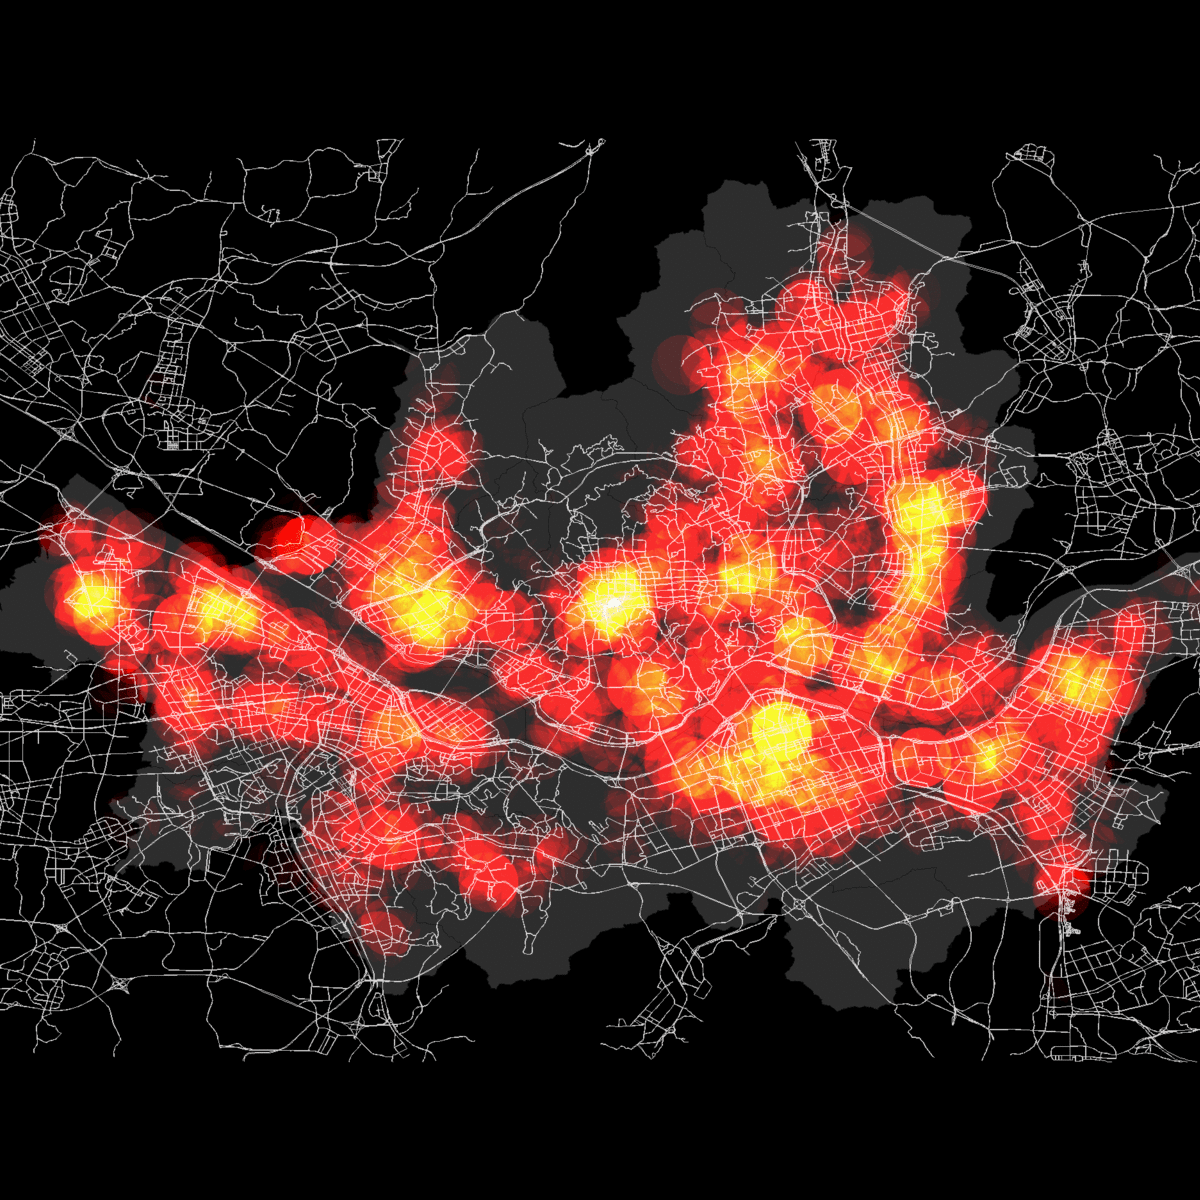
Spatial Data Science and Applications
Spatial (map) is considered as a core infrastructure of modern IT world, which is substantiated by business transactions of major IT companies such as Apple, Google, Microsoft, Amazon, Intel, and Uber, and even motor companies such as Audi, BMW, and Mercedes. Consequently, they are bound to hire more and more spatial data scientists. Based on such business trend, this course is designed to present a firm understanding of spatial data science to the learners, who would have a basic knowledge of data science and data analysis, and eventually to make their expertise differentiated from other nominal data scientists and data analysts. Additionally, this course could make learners realize the value of spatial big data and the power of open source software's to deal with spatial data science problems.
This course will start with defining spatial data science and answering why spatial is special from three different perspectives - business, technology, and data in the first week. In the second week, four disciplines related to spatial data science - GIS, DBMS, Data Analytics, and Big Data Systems, and the related open source software's - QGIS, PostgreSQL, PostGIS, R, and Hadoop tools are introduced together. During the third, fourth, and fifth weeks, you will learn the four disciplines one by one from the principle to applications. In the final week, five real world problems and the corresponding solutions are presented with step-by-step procedures in environment of open source software's.
Qualitative Research Methods
In this course you will be introduced to the basic ideas behind the qualitative research in social science. You will learn about data collection, description, analysis and interpretation in qualitative research. Qualitative research often involves an iterative process. We will focus on the ingredients required for this process: data collection and analysis.
You won't learn how to use qualitative methods by just watching video's, so we put much stress on collecting data through observation and interviewing and on analysing and interpreting the collected data in other assignments.
Obviously, the most important concepts in qualitative research will be discussed, just as we will discuss quality criteria, good practices, ethics, writing some methods of analysis, and mixing methods.
We hope to take away some prejudice, and enthuse many students for qualitative research.
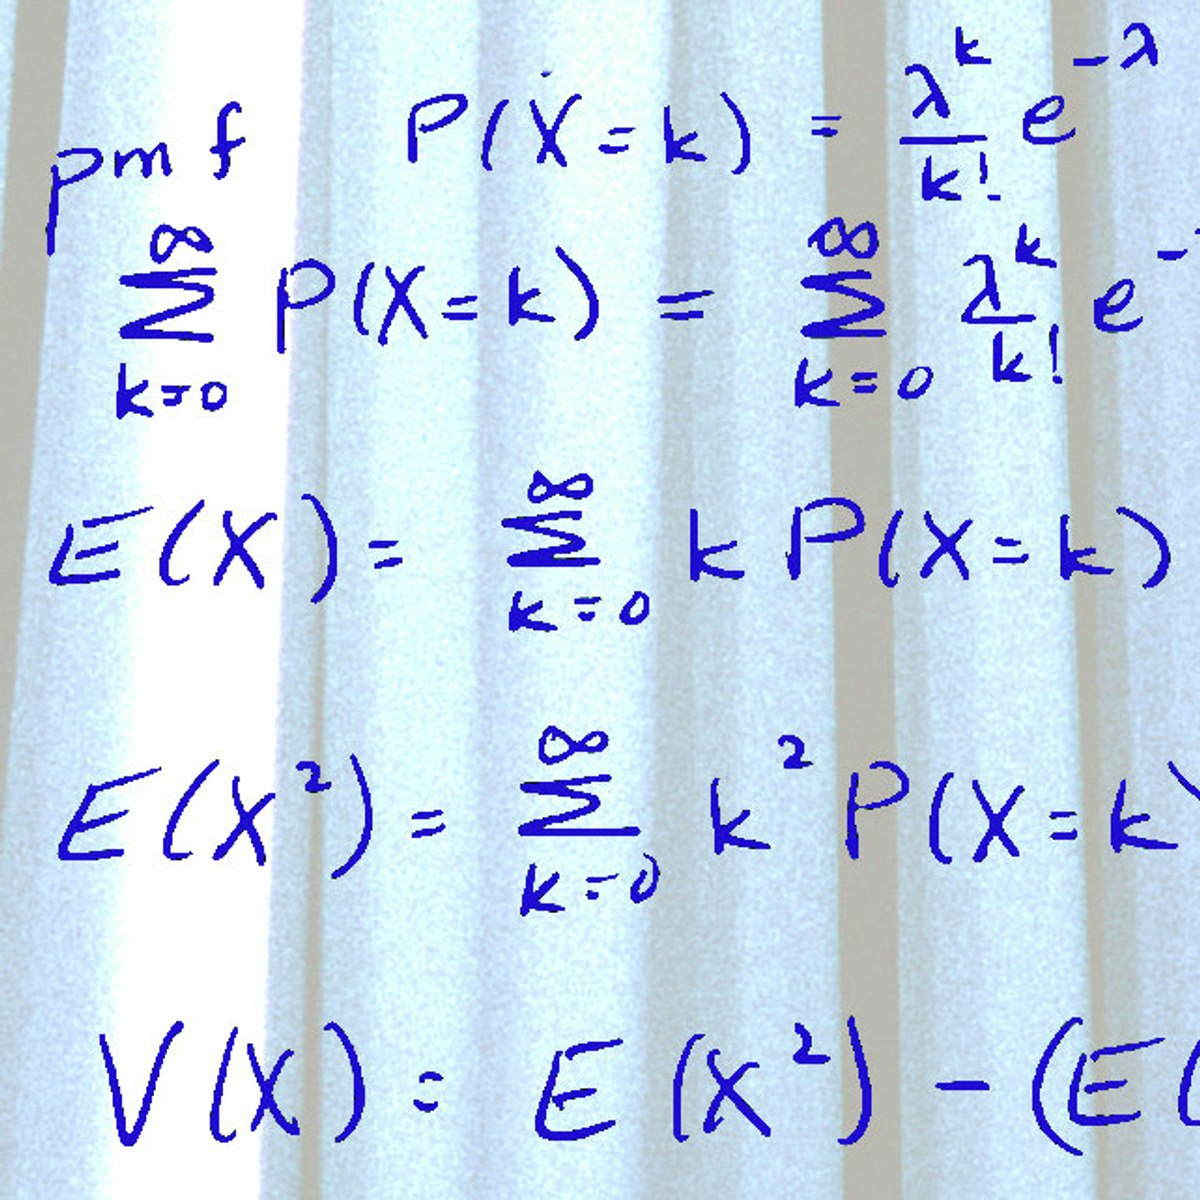
Probability Theory: Foundation for Data Science
Understand the foundations of probability and its relationship to statistics and data science. We’ll learn what it means to calculate a probability, independent and dependent outcomes, and conditional events. We’ll study discrete and continuous random variables and see how this fits with data collection. We’ll end the course with Gaussian (normal) random variables and the Central Limit Theorem and understand its fundamental importance for all of statistics and data science.
This course can be taken for academic credit as part of CU Boulder’s Master of Science in Data Science (MS-DS) degree offered on the Coursera platform. The MS-DS is an interdisciplinary degree that brings together faculty from CU Boulder’s departments of Applied Mathematics, Computer Science, Information Science, and others. With performance-based admissions and no application process, the MS-DS is ideal for individuals with a broad range of undergraduate education and/or professional experience in computer science, information science, mathematics, and statistics. Learn more about the MS-DS program at https://www.coursera.org/degrees/master-of-science-data-science-boulder
Logo adapted from photo by Christopher Burns on Unsplash.
Getting Started with SAS Programming
This course is for users who want to learn how to write SAS programs to access, explore, prepare, and analyze data. It is the entry point to learning SAS programming for data science, machine learning, and artificial intelligence. It is a prerequisite to many other SAS courses.
By the end of this course, you will know how to use SAS Studio to write and submit SAS programs that access SAS, Microsoft Excel, and text data. You will know how to explore and validate data, prepare data by subsetting rows and computing new columns, analyze and report on data, export data and results to other formats, use SQL in SAS to query and join tables.
Prerequisites:
Learners should have experience using computer software. Specifically, you should be able to understand file structures and system commands on your operating systems and access data files on your operating systems. No prior SAS experience is needed.
Popular Internships and Jobs by Categories
Find Jobs & Internships
Browse


© 2024 BoostGrad | All rights reserved