Back to Courses


Data Analysis Courses - Page 43
Showing results 421-430 of 998
Process Data with Microsoft Azure Synapse Link for Cosmo DB
In the past, performing traditional analytical workloads with Azure Cosmos DB has been a challenge. ETL mechanisms to migrate data from Cosmos DB to platforms more suited to performing analytics on data exist, but are a challenge to develop and maintain.
Azure Synapse Link for Cosmos DB addresses the needs to perform analytics over our transactional data without impacting our transactional workloads.
This is made possible through the Azure Cosmos DB Analytical store, which allows us to sync our transactional data into an isolated column store without us having to develop and manage complex ETL jobs, providing us with near real-time analytical capability on our data. In this project we will step through the process of configuring the services and process data using the Microsoft Azure Synapse Link for Cosmo DB.
If you enjoy this project, we recommend taking the Microsoft Azure Data Fundamentals DP-900 Exam Prep Specialization: https://www.coursera.org/specializations/microsoft-azure-dp-900-data-fundamentals
Increasing Real Estate Management Profits: Harnessing Data Analytics
In this final course you will complete a Capstone Project using data analysis to recommend a method for improving profits for your company, Watershed Property Management, Inc. Watershed is responsible for managing thousands of residential rental properties throughout the United States. Your job is to persuade Watershed’s management team to pursue a new strategy for managing its properties that will increase their profits. To do this, you will: (1) Elicit information about important variables relevant to your analysis; (2) Draw upon your new MySQL database skills to extract relevant data from a real estate database; (3) Implement data analysis in Excel to identify the best opportunities for Watershed to increase revenue and maximize profits, while managing any new risks; (4) Create a Tableau dashboard to show Watershed executives the results of a sensitivity analysis; and (5) Articulate a significant and innovative business process change for Watershed based on your data analysis, that you will recommend to company executives.
Airbnb, our Capstone’s official Sponsor, provided input on the project design. The top 10 Capstone completers each year will have the opportunity to present their work directly to senior data scientists at Airbnb live for feedback and discussion.
"Note: Only learners who have passed the four previous courses in the specialization are eligible to take the Capstone."
RPA Lifecycle: Development and Testing
To adopt RPA, you begin with the Discovery and Design phases and proceed onto the Development and Testing phase.
RPA Lifecycle – Development and Testing is the second course of the Specialization on Implementing RPA with Cognitive Solutions and Analytics.
In this course, you will learn how to develop and test bots. For this, you will use Automation Anywhere Enterprise Client (or AAE Client) to record, modify, and run tasks. AAE Client is a desktop application with an intuitive interface, that enables the creation of automated tasks with ease. It features ‘SMART’ Automation technology that quickly automates complex tasks without the need for any programming efforts. The learning will be reinforced through concept description, building bots, and guided practice.
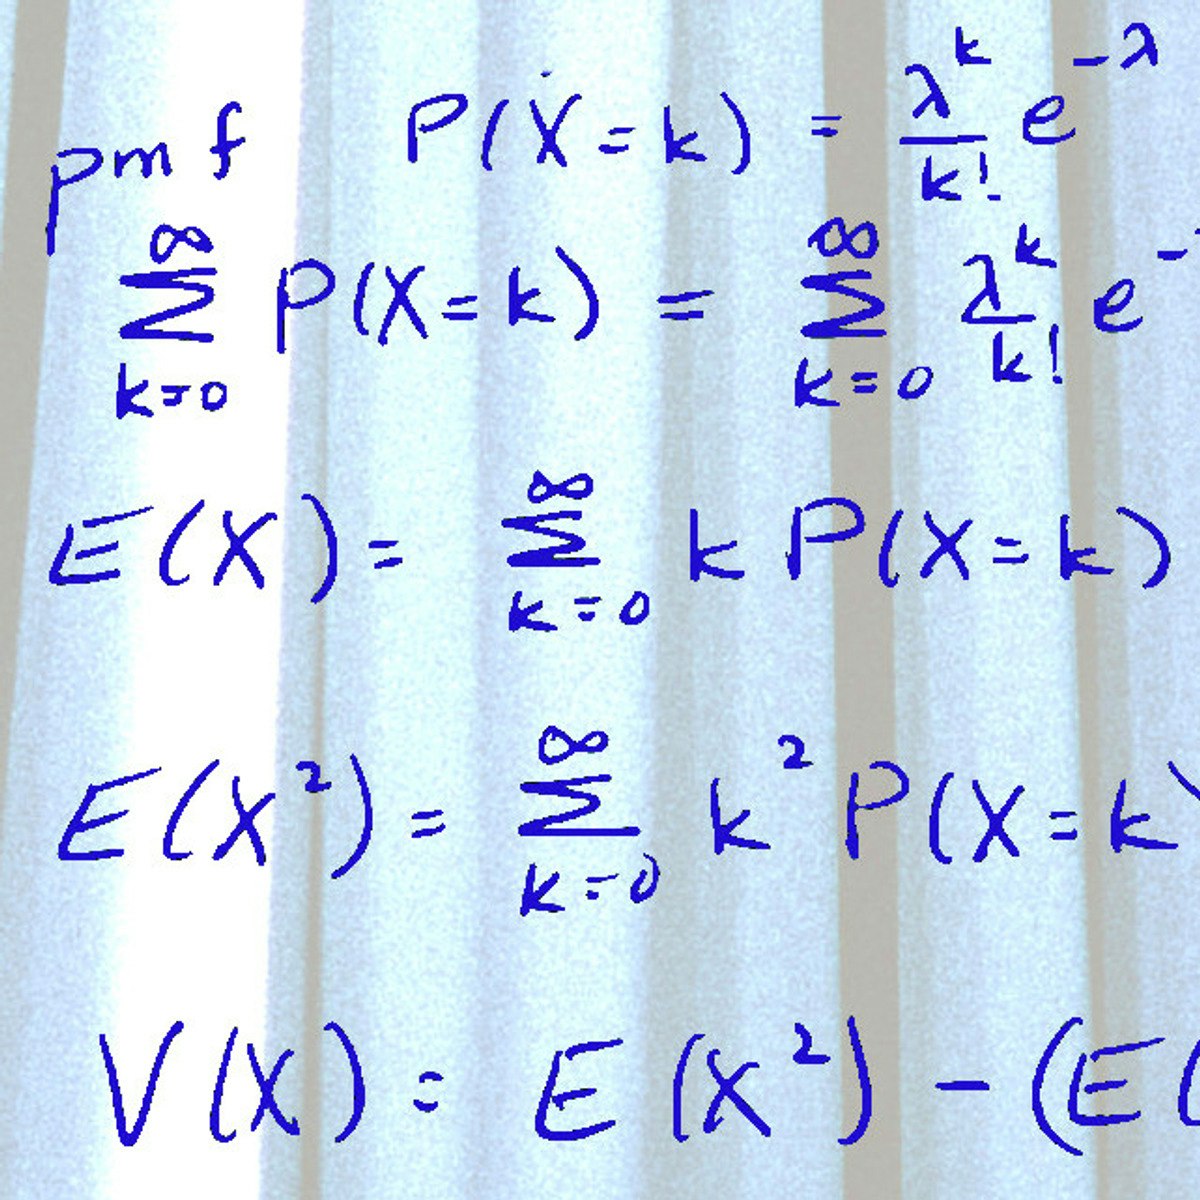
Statistical Inference for Estimation in Data Science
This course introduces statistical inference, sampling distributions, and confidence intervals. Students will learn how to define and construct good estimators, method of moments estimation, maximum likelihood estimation, and methods of constructing confidence intervals that will extend to more general settings.
This course can be taken for academic credit as part of CU Boulder’s Master of Science in Data Science (MS-DS) degree offered on the Coursera platform. The MS-DS is an interdisciplinary degree that brings together faculty from CU Boulder’s departments of Applied Mathematics, Computer Science, Information Science, and others. With performance-based admissions and no application process, the MS-DS is ideal for individuals with a broad range of undergraduate education and/or professional experience in computer science, information science, mathematics, and statistics. Learn more about the MS-DS program at https://www.coursera.org/degrees/master-of-science-data-science-boulder.
Logo adapted from photo by Christopher Burns on Unsplash.
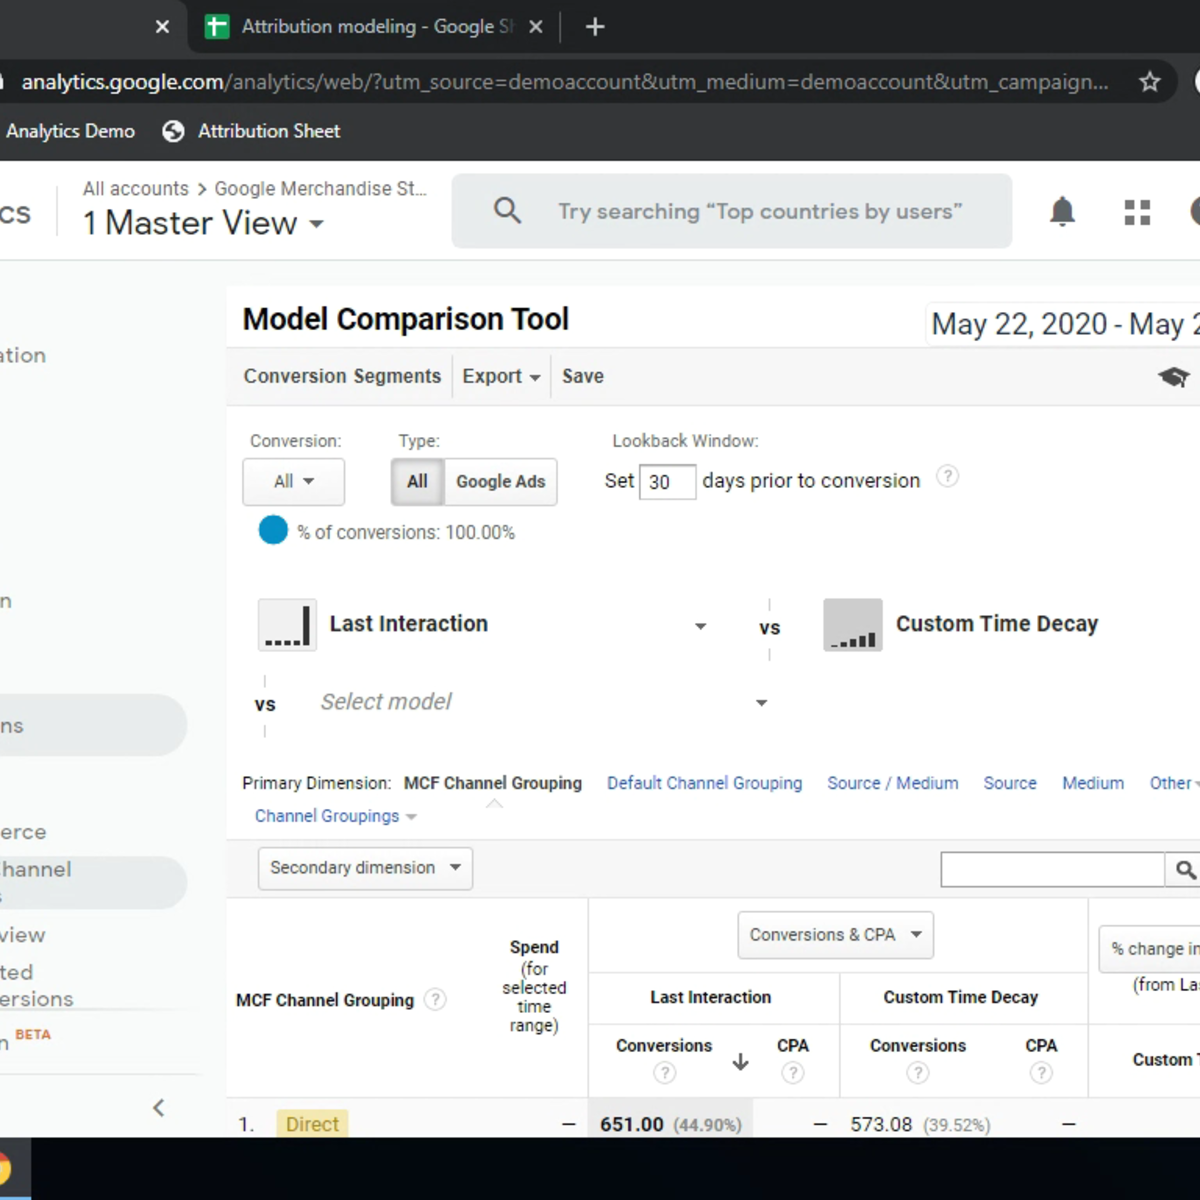
Custom Attribution Modeling with Google Analytics
In this 1-hour long project-based course, you will learn how to build and share a custom attribution model in Google Analytics, understand attribution modeling, export and import data for elaboration outside of Analytics platform.
Note: This course works best for learners who are based in the North America region. We’re currently working on providing the same experience in other regions.
Bayesian Statistics
This course describes Bayesian statistics, in which one's inferences about parameters or hypotheses are updated as evidence accumulates. You will learn to use Bayes’ rule to transform prior probabilities into posterior probabilities, and be introduced to the underlying theory and perspective of the Bayesian paradigm. The course will apply Bayesian methods to several practical problems, to show end-to-end Bayesian analyses that move from framing the question to building models to eliciting prior probabilities to implementing in R (free statistical software) the final posterior distribution. Additionally, the course will introduce credible regions, Bayesian comparisons of means and proportions, Bayesian regression and inference using multiple models, and discussion of Bayesian prediction.
We assume learners in this course have background knowledge equivalent to what is covered in the earlier three courses in this specialization: "Introduction to Probability and Data," "Inferential Statistics," and "Linear Regression and Modeling."
Automating Image Processing
In this course, you will build on the skills acquired in Image Segmentation, Filtering, and Region Analysis to explore large sets of images and video files. It’s impractical to manually inspect results in large data sets. Automating image processing allows you to do your work more efficiently.
At the end of this course, you’ll apply all the skills learned in this specialization to a final project. You’ll take the role of an engineer being asked to monitor traffic on a busy road. You’ll detect cars from a noisy video and analyze the results.
You will use MATLAB throughout this course. MATLAB is the go-to choice for millions of people working in engineering and science, and provides the capabilities you need to accomplish your image processing tasks. You will be provided with free access to MATLAB for the duration of the course to complete your work.
To be successful in this course you should have a background in basic math and some exposure to MATLAB. If you want to familiarize yourself with MATLAB check out the free, two-hour MATLAB Onramp. Experience with image processing is not required.
Creating dynamic SQL derived tables with LookML and Liquid
This is a Google Cloud Self-Paced Lab. In this lab you will learn how to create and update SQL derived tables to generate dynamic values.
Business Case for Cloud Workloads
Learn what a workloads placement strategy is, why it is important, and how to demonstrate to customers the tangible value that Intel® technical optimizations offer as part of the workload placement process.
● Cloud Customer Business Drivers and Requirements: This lesson identifies what business and ecosystem drivers lead a business to adopt a cloud infrastructure and what requirements that should incorporate into their cloud business decisions. (Duration: 30 minutes)
● Cloud Services Business Impacts: In this lesson you will learn about cloud services considerations, cloud transformation business methodology, and the value of Intel technology in the cloud. (Duration: 30 minutes)
● Yes: This lesson describes the challenges businesses face in building a digital enterprise and how the cloud supported by Intel® technology help deliver strong value in meeting their business requirements. (Duration: 30 minutes)
● Aligning Cloud Business Needs - Use Case Discussions: This lesson provides role play scenarios describing how to handle four distinct cloud business use case discussions. (Duration: 41 minutes)
Multiple Linear Regression with scikit-learn
In this 2-hour long project-based course, you will build and evaluate multiple linear regression models using Python. You will use scikit-learn to calculate the regression, while using pandas for data management and seaborn for data visualization. The data for this project consists of the very popular Advertising dataset to predict sales revenue based on advertising spending through media such as TV, radio, and newspaper.
By the end of this project, you will be able to:
- Build univariate and multivariate linear regression models using scikit-learn
- Perform Exploratory Data Analysis (EDA) and data visualization with seaborn
- Evaluate model fit and accuracy using numerical measures such as R² and RMSE
- Model interaction effects in regression using basic feature engineering techniques
This course runs on Coursera's hands-on project platform called Rhyme. On Rhyme, you do projects in a hands-on manner in your browser. You will get instant access to pre-configured cloud desktops containing all of the software and data you need for the project. Everything is already set up directly in your internet browser so you can just focus on learning. For this project, this means instant access to a cloud desktop with Jupyter Notebooks and Python 3.7 with all the necessary libraries pre-installed.
Notes:
- You will be able to access the cloud desktop 5 times. However, you will be able to access instructions videos as many times as you want.
- This course works best for learners who are based in the North America region. We’re currently working on providing the same experience in other regions.
Popular Internships and Jobs by Categories
Find Jobs & Internships
Browse


© 2024 BoostGrad | All rights reserved