Back to Courses


Data Analysis Courses - Page 41
Showing results 401-410 of 998
How to use Custom and Conditional Formatting in Excel
By the end of this project, you will learn how to use conditional and custom formatting in an Excel Spreadsheet by using a free version of Microsoft Office Excel.
Excel is a spreadsheet that is similar in layout as accounting spreadsheets. It consists of individual cells that can be used to build functions, formulas, tables, and graphs that easily organize and analyze large amounts of information and data. Conditional formatting is a convenient tool for data analysis and visual representation of results. Knowing how to use this tool will save you a lot of time and effort. A fleet glance at the document will be enough to obtain the necessary information.
Data Analytics Foundations for Accountancy I
Welcome to Data Analytics Foundations for Accountancy I! You’re joining thousands of learners currently enrolled in the course. I'm excited to have you in the class and look forward to your contributions to the learning community.
To begin, I recommend taking a few minutes to explore the course site. Review the material we’ll cover each week, and preview the assignments you’ll need to complete to pass the course. Click Discussions to see forums where you can discuss the course material with fellow students taking the class.
If you have questions about course content, please post them in the forums to get help from others in the course community. For technical problems with the Coursera platform, visit the Learner Help Center.
Good luck as you get started, and I hope you enjoy the course!
Introduction to Python
Learning Python gives the programmer a wide variety of career paths to choose from. Python is an open-source (free) programming language that is used in web programming, data science, artificial intelligence, and many scientific applications. Learning Python allows the programmer to focus on solving problems, rather than focusing on syntax. Its relative size and simplified syntax give it an edge over languages like Java and C++, yet the abundance of libraries gives it the power needed to accomplish great things.
In this tutorial you will create a guessing game application that pits the computer against the user. You will create variables, decision constructs, and loops in python to create the game.
Note: This course works best for learners who are based in the North America region. We’re currently working on providing the same experience in other regions.
Create a C# Application to process MongoDB Data
By the end of this project, you will create a C# application using MongoDB to access Employee data perform CRUD operations on the MongoDB database.
Many Applications use a MongoDB database on the backend, and nearly every programming language has a driver for it. Since MongoDB is a No-SQL database, it works quite well for storing C# objects. Conversely, reading MongoDB documents into C# objects is quite seamless, especially when compared to reading Relational database data into objects.
Note: This course works best for learners who are based in the North America region. We’re currently working on providing the same experience in other regions.
Statistics for Marketing
This course takes a deep dive into the statistical foundation upon which Marketing Analytics is built. The first part of this course is all about getting a thorough understanding of a dataset and gaining insight into what the data actually means. The second part of this course goes into sampling and how to ask specific questions about your data. Finally, the third part is about answering those questions with analyses. Many of the mistakes made by Marketing Analysts today are caused by not understanding the concepts behind the analytics they run, which causes them to run the wrong test or misinterpret the results. This course is specifically designed to give you the background you need to understand what you are doing and why you are doing it on a practical level.
By the end of this course you will be able to:
• Understand the concept of dependent and independent variables
• Identify variables to test
• Understand the Null Hypothesis, P-Values, and their role in testing hypotheses
• Formulate a hypothesis and align hypotheses with business goals
• Identify actions based on hypothesis validation/invalidation
• Explain Descriptive Statistics (mean, median, standard deviation, distribution) and their use cases
• Understand basic concepts from Inferential Statistics
• Explain the different levels of analytics (descriptive, predictive, prescriptive) in the context of marketing
• Create basic statistical models for regression using data
• Create time-series forecasts using historical data and basic statistical models
• Understand the basic assumptions, use cases, and limitations of Linear Regression
• Fit a linear regression model to a dataset and interpret the output using Tableau and statsmodels
• Explain the difference between linear and multivariate regression
• Run a segmentation (cluster) analysis
• Describe the difference between observational methods and experiments
This course is designed for people who want to learn the basics of descriptive and inferential statistics and analytics in marketing.
Learners don't need marketing or data analysis experience, but should have basic internet navigation skills and be eager to participate. Ideally learners have already completed course 1 (Marketing Analytics Foundation) and course 2 (Introduction to Data Analytics) in this program.
Transforming Data in R
In this 1-hour long project-based course, you will learn how to pivot data into wide and long format, split and combine cells and columns, handling missing values, select groups of observations and variables, and join data from different tables.
Note: This course works best for learners who are based in the North America region. We’re currently working on providing the same experience in other regions.
Statistical Forecasting Techniques in Google Sheets
We consume forecasted data regularly in our personal and business lives, covering everything from the weather to projected investment returns. At work we use forecasted data for a multitude of purposes including developing strategies, budgets, and to provide the right amount of resources to meet demand. In this course, you will get your feet wet with statistical forecasting by designing, creating, and interpreting a growth forecast. You will do this as we work side-by-side in the free-to-use software Google Sheets.
By the end of this course, you will understand use cases for conducting forecasts in your workplace and be able to confidently conduct a growth forecast in any spreadsheet software. You will also understand when it is necessary to refine a model to improve the accuracy of forecasted projections.
Note: This course works best for learners who are based in the North America region. We’re currently working on providing the same experience in other regions.
Data Visualization & Storytelling in Python
Hello everyone and welcome to this new hands-on project on data visualization and storytelling in python. In this project, we will leverage 3 powerful libraries known as Seaborn, Matplotlib and Plotly to visualize data in an interactive way. This project is practical and directly applicable to many industries. You can add this project to your portfolio of projects which is essential for your next job interview.
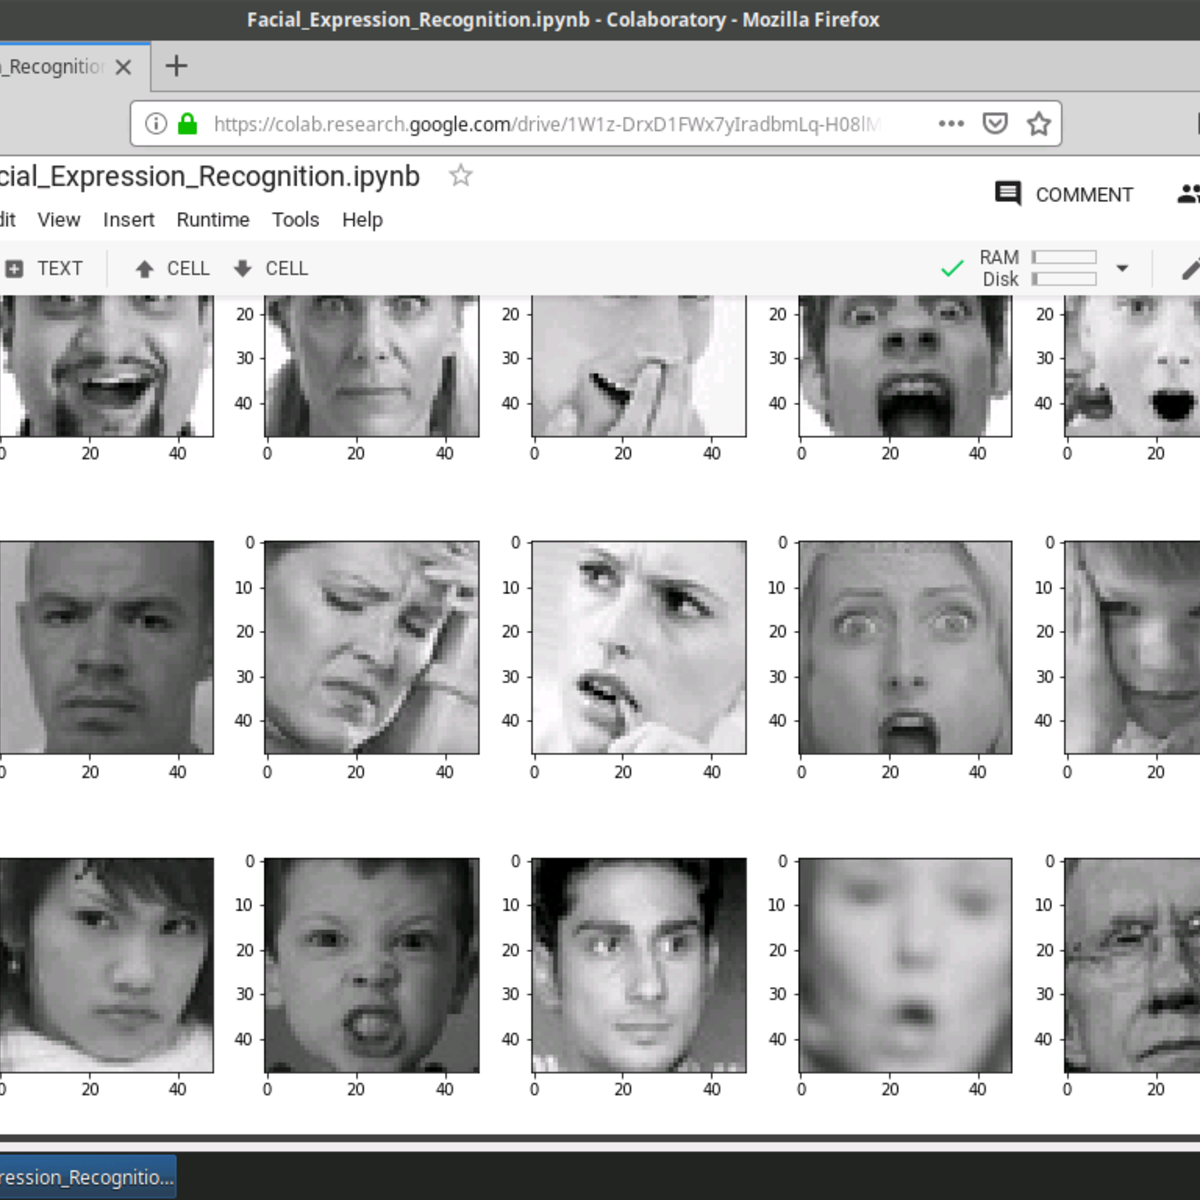
Facial Expression Recognition with Keras
In this 2-hour long project-based course, you will build and train a convolutional neural network (CNN) in Keras from scratch to recognize facial expressions. The data consists of 48x48 pixel grayscale images of faces. The objective is to classify each face based on the emotion shown in the facial expression into one of seven categories (0=Angry, 1=Disgust, 2=Fear, 3=Happy, 4=Sad, 5=Surprise, 6=Neutral). You will use OpenCV to automatically detect faces in images and draw bounding boxes around them. Once you have trained, saved, and exported the CNN, you will directly serve the trained model to a web interface and perform real-time facial expression recognition on video and image data.
This course runs on Coursera's hands-on project platform called Rhyme. On Rhyme, you do projects in a hands-on manner in your browser. You will get instant access to pre-configured cloud desktops containing all of the software and data you need for the project. Everything is already set up directly in your internet browser so you can just focus on learning. For this project, you’ll get instant access to a cloud desktop with Python, Jupyter, and Keras pre-installed.
Notes:
- You will be able to access the cloud desktop 5 times. However, you will be able to access instructions videos as many times as you want.
- This course works best for learners who are based in the North America region. We’re currently working on providing the same experience in other regions.
Executive Data Science Capstone
The Executive Data Science Capstone, the specialization’s culminating project, is an opportunity for people who have completed all four EDS courses to apply what they've learned to a real-world scenario developed in collaboration with Zillow, a data-driven online real estate and rental marketplace, and DataCamp, a web-based platform for data science programming. Your task will be to lead a virtual data science team and make key decisions along the way to demonstrate that you have what it takes to shepherd a complex analysis project from start to finish. For the final project, you will prepare and submit a presentation, which will be evaluated and graded by your fellow capstone participants.
Course cover image by Luckey_sun. Creative Commons BY-SA https://flic.kr/p/bx1jvU
Popular Internships and Jobs by Categories
Find Jobs & Internships
Browse
© 2024 BoostGrad | All rights reserved