Back to Courses


Data Management Courses - Page 35
Showing results 341-350 of 399

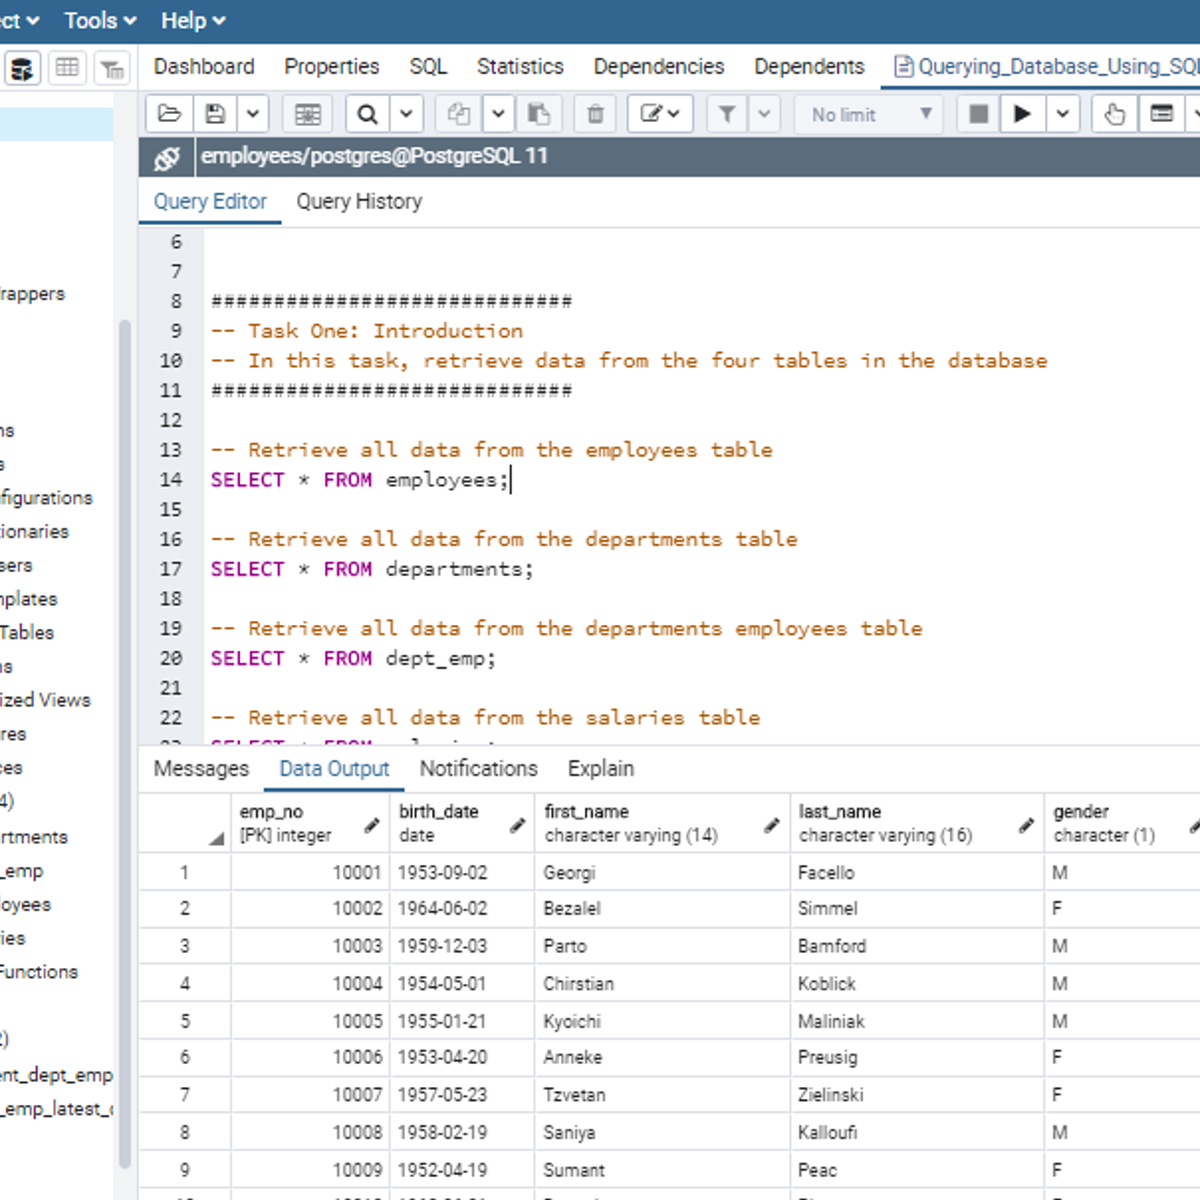
Querying Databases Using SQL SELECT statement
In this 2-hour long project-based course, you will learn how to retrieve data from tables in a database using SQL SELECT statement. In addition, this project will expose you to how to use different SQL operators together with the WHERE clause to set conditions on tables in a database for database manipulation. In order to reinforce the use of SQL SELECT statement to query a database for database insights, you will work on different tasks as the concepts are being introduced to you.
Note: You do not need to be a data administrator or data analyst to be successful in this guided project, just a familiarity with SQL is required. If you are not familiar with SQL and want to learn the basics, start with my previous guided project titled “Performing Data Definition and Manipulation in SQL”.

Everyday Excel, Part 3 (Projects)
"Everyday Excel, Part 3 (Projects)" is a continuation of "Everyday Excel, Parts 1 and 2". It is a capstone, projects-based course in which you will apply what you've learned previously to more complex, somewhat open-ended projects (open-ended with respect to the fact that they can be solved in multiple ways).
Each learner must complete 3"warm-up" projects (chosen from 3), 3 intermediate projects (chosen from 6), and 3 main (more difficult) projects (chosen from 5). The projects have been created to span a wide range of interests and topic areas and are anticipated to appeal to diverse learner backgrounds.
It is hoped that this project-based courses will dramatically reinforce the application of Excel tools, techniques, and functions to real-world projects.

Using Ruby on Rails with Cloud SQL for PostgreSQL on Cloud Run
This is a self-paced lab that takes place in the Google Cloud console. In this lab, you'll learn how to deploy a new Ruby on Rails application using Google Cloud SQL for PostgreSQL on Cloud Run.

Creating Date-Partitioned Tables in BigQuery
This is a self-paced lab that takes place in the Google Cloud console. This lab focuses on how to query partitioned datasets and how to create your own dataset partitions to improve query performance, which reduces cost.

Use Charts in Google Sheets
This is a self-paced lab that takes place in the Google Cloud console. Learn to create pie charts, column charts, combo charts and scatter charts in Google Sheets. You also create sparklines and progress bars and learn how to share your spreadsheet in Google Slides and over the web.

Introduction to Databases
In this course, you will be introduced to databases and explore the modern ways in which they are used. Learn to distinguish between different types of database management systems then practice basic creation and data selection with the use of Structured Query Language (SQL) commands.
By the end of this course, you’ll be able to:
- Demonstrate a working knowledge of the concepts and principles that underpin how databases work
- Identify and explain the different types of core technology and management systems used in
databases
- Identify and interpret basic SQL statements and commands
- Manipulate records in a database with the use of SQL statements and commands
- Outline alternatives to SQL
- and plan and design a simple relational database system
You’ll also gain experience with the following:
• Fundamental concepts in database
• Basic MySQL syntax and commands
• Database management systems
• MySQL software
• Relational databases

Information Visualization: Applied Perception
This module aims at introducing fundamental concepts of visual perception applied to information visualization. These concepts help the student ideate and evaluate visualization designs in terms of how well they leverage the capabilities of the human perceptual machinery.

Query Client Data with LibreOffice Base
By the end of this project you will have used the Query Design window in LibreOffice Base to construct and run queries that retrieve, sort, filter, and perform calculations on data from a multi-table relational Client database. Results returned from a query can be used to analyze client data to support business decisions.
Note: This course works best for learners who are based in the North America region. We’re currently working on providing the same experience in other regions.

Analyzing and Visualizing Data in Looker
In this course, you learn how to do the kind of data exploration and analysis in Looker that would formerly be done primarily by SQL developers or analysts. Upon completion of this course, you will be able to leverage Looker's modern analytics platform to find and explore relevant content in your organization’s Looker instance, ask questions of your data, create new metrics as needed, and build and share visualizations and dashboards to facilitate data-driven decision making.

IBM Data Topology
Every business and organization is facing new challenges with their data. Pressures related to regulation and compliance, leveraging AI, spanning multicloud environments, and increasing volumes of inaccessible data are forcing executives and administrators to either modernize their infrastructures or become obsolete. But moving to the latest technology in a monolithic architecture is a tempting solution that can be expensive and cause more problems than it solves. In this course, you learn how to meet the needs of all your data consumers through the construction of a modern logical topology that helps you optimize data flow.
Popular Internships and Jobs by Categories
Browse
© 2024 BoostGrad | All rights reserved


