Back to Courses


Data Science Courses - Page 94
Showing results 931-940 of 1407
Excel Fundamentals for Data Analysis
As data becomes the modern currency, so the ability to analyse the data quickly and accurately has become of paramount importance. Excel with its extraordinarily broad range of features and capabilities is one of the most widely used programs for doing this. In the first course of our Excel Skills for Data Analysis and Visualization Specialization, you will learn the fundamentals of Excel for data analysis. When you have completed the course, you will be able to use a range of Excel tools and functions to clean and prepare data for analysis; automate data analysis with the help of Named Ranges and Tables; and use logical and lookup functions to transform, link and categorise data.
This course will enable you to build a strong foundation in the fundamentals, helping you to be more efficient in your day-to-day and developing the necessary skills to work with the more advanced techniques used in later courses. To make the content easy to relate to and to personalize the learning experience, we are going to follow Zara's journey through the course. Who is Zara? Well, she is no-one and everyone. You will find that Zara's trials and tribulations sound familiar, and together with Zara, you will develop your Excel skills along the way — and, importantly, have some fun doing it.
The Excel Skills for Data Analytics and Visualization courses are the sequel to one of most successful specializations on Coursera, Excel Skills for Business, which has attracted hundreds of thousands of learners and top ratings. Transform your skills, your confidence, and your opportunities by adding this new set of skills to your repertoire.
Explore and Create Reports with Data Studio
This is a self-paced lab that takes place in the Google Cloud console.
In this lab, you learn how to connect Google Data Studio to Google BigQuery data tables, create charts, and explore the relationships between dimensions and measures.
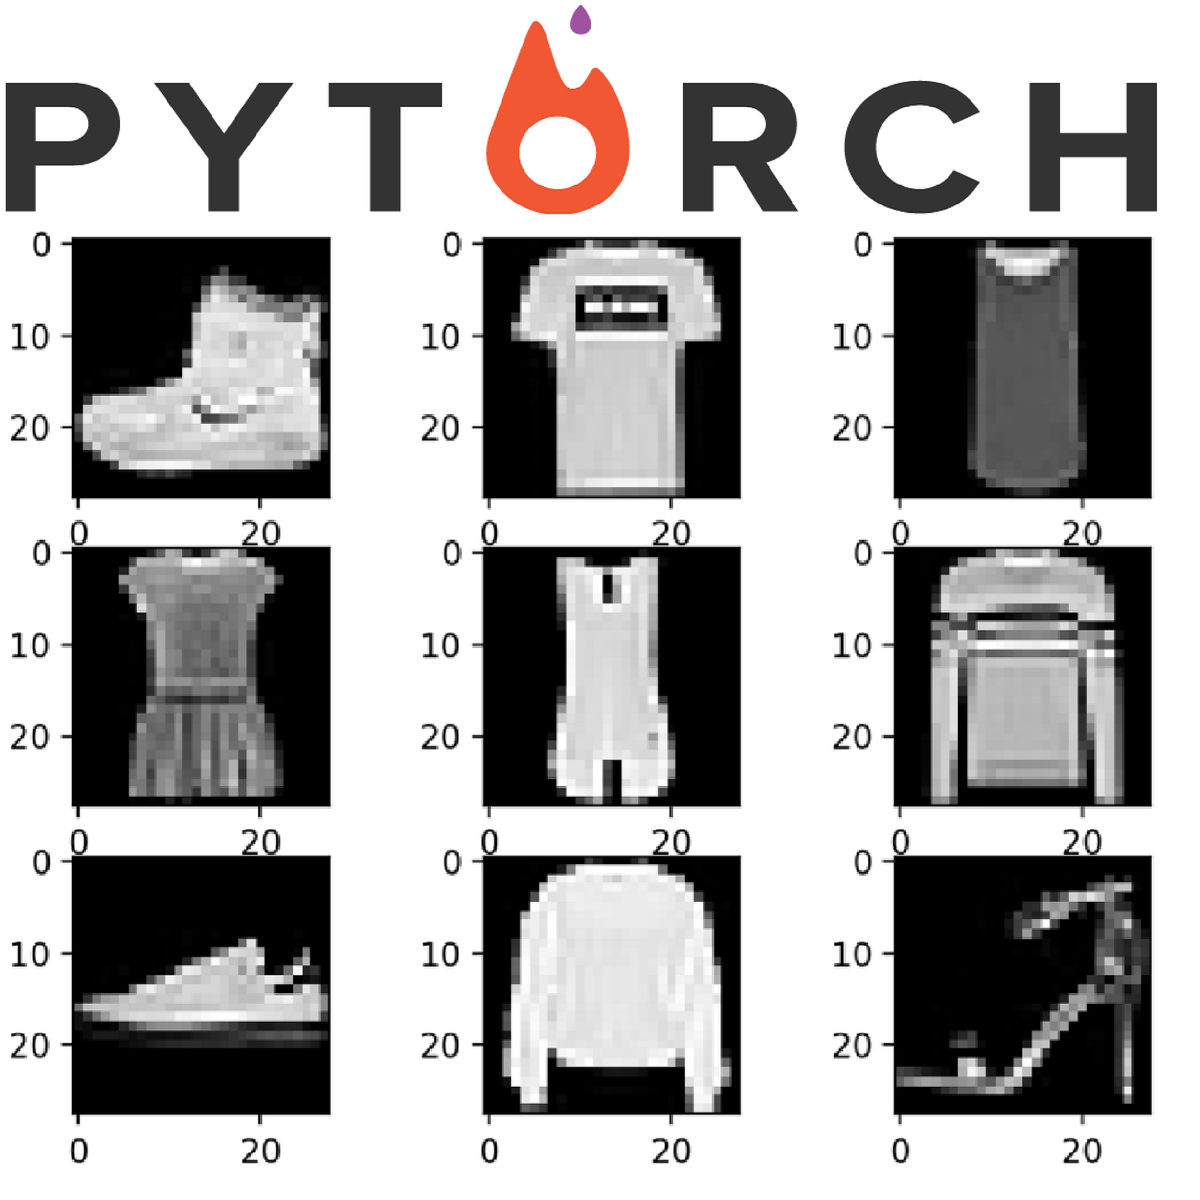
Fashion Image Classification using CNNs in Pytorch
In this 1-hour long project-based course, you will learn how to create Neural Networks in the Deep Learning Framework PyTorch. We will creating a Convolutional Neural Network for a 10 Class Image Classification problem which can be extended to more classes. We will start off by looking at how perform data preparation and Augmentation in Pytorch.
We will be building a Neural Network in Pytorch. We will add the Convolutional Layers as well as Linear Layers. We will then look at how to add optimizer and train the model. Finally, we will test and evaluate our model on test data.
The project will get you introduced with Pytorch. You will in the end understand how the framework works and get you started with building Neural Networks in Pytorch.
Note: This course works best for learners who are based in the North America region. We’re currently working on providing the same experience in other regions.
Mastering Data Analysis in Excel
Important: The focus of this course is on math - specifically, data-analysis concepts and methods - not on Excel for its own sake. We use Excel to do our calculations, and all math formulas are given as Excel Spreadsheets, but we do not attempt to cover Excel Macros, Visual Basic, Pivot Tables, or other intermediate-to-advanced Excel functionality.
This course will prepare you to design and implement realistic predictive models based on data. In the Final Project (module 6) you will assume the role of a business data analyst for a bank, and develop two different predictive models to determine which applicants for credit cards should be accepted and which rejected. Your first model will focus on minimizing default risk, and your second on maximizing bank profits. The two models should demonstrate to you in a practical, hands-on way the idea that your choice of business metric drives your choice of an optimal model.
The second big idea this course seeks to demonstrate is that your data-analysis results cannot and should not aim to eliminate all uncertainty. Your role as a data-analyst is to reduce uncertainty for decision-makers by a financially valuable increment, while quantifying how much uncertainty remains. You will learn to calculate and apply to real-world examples the most important uncertainty measures used in business, including classification error rates, entropy of information, and confidence intervals for linear regression.
All the data you need is provided within the course, all assignments are designed to be done in MS Excel, and you will learn enough Excel to complete all assignments. The course will give you enough practice with Excel to become fluent in its most commonly used business functions, and you’ll be ready to learn any other Excel functionality you might need in the future (module 1).
The course does not cover Visual Basic or Pivot Tables and you will not need them to complete the assignments. All advanced concepts are demonstrated in individual Excel spreadsheet templates that you can use to answer relevant questions. You will emerge with substantial vocabulary and practical knowledge of how to apply business data analysis methods based on binary classification (module 2), information theory and entropy measures (module 3), and linear regression (module 4 and 5), all using no software tools more complex than Excel.
Analyze Datasets and Train ML Models using AutoML
In the first course of the Practical Data Science Specialization, you will learn foundational concepts for exploratory data analysis (EDA), automated machine learning (AutoML), and text classification algorithms. With Amazon SageMaker Clarify and Amazon SageMaker Data Wrangler, you will analyze a dataset for statistical bias, transform the dataset into machine-readable features, and select the most important features to train a multi-class text classifier. You will then perform automated machine learning (AutoML) to automatically train, tune, and deploy the best text-classification algorithm for the given dataset using Amazon SageMaker Autopilot. Next, you will work with Amazon SageMaker BlazingText, a highly optimized and scalable implementation of the popular FastText algorithm, to train a text classifier with very little code.
Practical data science is geared towards handling massive datasets that do not fit in your local hardware and could originate from multiple sources. One of the biggest benefits of developing and running data science projects in the cloud is the agility and elasticity that the cloud offers to scale up and out at a minimum cost.
The Practical Data Science Specialization helps you develop the practical skills to effectively deploy your data science projects and overcome challenges at each step of the ML workflow using Amazon SageMaker. This Specialization is designed for data-focused developers, scientists, and analysts familiar with the Python and SQL programming languages and want to learn how to build, train, and deploy scalable, end-to-end ML pipelines - both automated and human-in-the-loop - in the AWS cloud.
Learning SAS: Reading Raw Data with the List Input Method
In this 1.04 hour long project-based course, you will be able to read in external files using an input method called list, manipulate Missing values, place the DATALINES keyword in your program as well as INFILE statements and work with a Comma Separated Values (CSV) file.
Note: This course works best for learners who are based in the North America region. We’re currently working on providing the same experience in other regions.
Artificial Intelligence Ethics in Action
AI Ethics research is an emerging field, and to prove our skills, we need to demonstrate our critical thinking and analytical ability. Since it's not reasonable to jump into a full research paper with our newly founded skills, we will instead work on 3 projects that will demonstrate your ability to analyze ethical AI across a variety of topics and situations. These projects include all the skills you've learned in this AI Ethics Specialization.
Machine Learning - Anomaly Detection via PyCaret
In this 2 hour long project-based course you will learn how to perform anomaly detection, its importance in machine learning, set up PyCaret anomaly detection, create, visualize & compare anomaly detection algorithms all this with just a few lines of code.
Getting Started with BigQuery Machine Learning
This is a self-paced lab that takes place in the Google Cloud console. In this lab, you'll learn how to use BigQuery to create machine learning models for datasets to create a model that predicts whether a visitor will make a transaction.
Social and Economic Networks: Models and Analysis
Learn how to model social and economic networks and their impact on human behavior. How do networks form, why do they exhibit certain patterns, and how does their structure impact diffusion, learning, and other behaviors? We will bring together models and techniques from economics, sociology, math, physics, statistics and computer science to answer these questions.
The course begins with some empirical background on social and economic networks, and an overview of concepts used to describe and measure networks. Next, we will cover a set of models of how networks form, including random network models as well as strategic formation models, and some hybrids. We will then discuss a series of models of how networks impact behavior, including contagion, diffusion, learning, and peer influences.
You can find a more detailed syllabus here: http://web.stanford.edu/~jacksonm/Networks-Online-Syllabus.pdf
You can find a short introductory videao here: http://web.stanford.edu/~jacksonm/Intro_Networks.mp4
Popular Internships and Jobs by Categories
Find Jobs & Internships
Browse


© 2024 BoostGrad | All rights reserved