Back to Courses


Data Science Courses - Page 78
Showing results 771-780 of 1407
Interpretable Machine Learning Applications: Part 2
By the end of this project, you will be able to develop intepretable machine learning applications explaining individual predictions rather than explaining the behavior of the prediction model as a whole. This will be done via the well known Local Interpretable Model-agnostic Explanations (LIME) as a machine learning interpretation and explanation model. In particular, in this project, you will learn how to go beyond the development and use of machine learning (ML) models, such as regression classifiers, in that we add on explainability and interpretation aspects for individual predictions.
In this sense, the project will boost your career as a ML developer and modeler in that you will be able to explain and justify the behaviour of your ML model. The project will also benefit your career as a decision-maker in an executive position interested in deploying trusted and accountable ML applications.
This guided project is primarily targeting data scientists and machine learning modelers, who wish to enhance their machine learning application development with explanation components for predictions being made. The guided project is also targeting executive planners within business companies and public organizations interested in using machine learning applications for automating, or informing, human decision making, not as a ‘black box’, but also gaining some insight into the behavior of a machine learning classifier.
Note: This guided project based course works best for learners who are based in the North America region. We’re currently working on providing the same experience in other regions.
Predict Visitor Purchases with a Classification Model in BQML
This is a self-paced lab that takes place in the Google Cloud console. In this lab, you will use a newly available ecommerce dataset to run some typical queries that businesses would want to know about their customers’ purchasing habits.
Advanced Portfolio Construction and Analysis with Python
The practice of investment management has been transformed in recent years by computational methods. Instead of merely explaining the science, we help you build on that foundation in a practical manner, with an emphasis on the hands-on implementation of those ideas in the Python programming language. In this course, we cover the estimation, of risk and return parameters for meaningful portfolio decisions, and also introduce a variety of state-of-the-art portfolio construction techniques that have proven popular in investment management and portfolio construction due to their enhanced robustness.
As we cover the theory and math in lecture videos, we'll also implement the concepts in Python, and you'll be able to code along with us so that you have a deep and practical understanding of how those methods work. By the time you are done, not only will you have a foundational understanding of modern computational methods in investment management, you'll have practical mastery in the implementation of those methods. If you follow along and implement all the lab exercises, you will complete the course with a powerful toolkit that you will be able to use to perform your own analysis and build your own implementations and perhaps even use your newly acquired knowledge to improve on current methods.
Relational Database Design
Have you ever wanted to build a database but don't know where to start? This course will provide you a step-by-step guidance. We are going to start from a raw idea to an implementable relational database. Getting on the path, practicing the real-life mini cases, you will be confident and comfortable with Relational Database Design. Let's get started!
Relational Database Design can be taken for academic credit as part of CU Boulder’s Master of Science in Data Science (MS-DS) degree offered on the Coursera platform. The MS-DS is an interdisciplinary degree that brings together faculty from CU Boulder’s departments of Applied Mathematics, Computer Science, Information Science, and others. With performance-based admissions and no application process, the MS-DS is ideal for individuals with a broad range of undergraduate education and/or professional experience in computer science, information science, mathematics, and statistics. Learn more about the MS-DS program at https://www.coursera.org/degrees/master-of-science-data-science-boulder.
Summary Statistics in Public Health
Biostatistics is the application of statistical reasoning to the life sciences, and it is the key to unlocking the data gathered by researchers and the evidence presented in the scientific literature. In this course, we'll focus on the use of statistical measurement methods within the world of public health research. Along the way, you'll be introduced to a variety of methods and measures, and you'll practice interpreting data and performing calculations on real data from published studies. Topics include summary measures, visual displays, continuous data, sample size, the normal distribution, binary data, the element of time, and the Kaplan-Meir curve.
Deploy A Microsoft Azure Speech To Text Web App
In this 2-hour-long project-based course, you will learn how to import the necessary python modules for Azure Speech to Text SDK, Create a function to transcribe audio to text, Build a web app using Streamlit and deploy the web app to Heroku.
This project is a beginner python project for anyone interested in learning about how to productionize cloud speech-to-text services, Azure, particularly through a web app on Heroku and leveraging python audio modules.
At the end of this project, learners will have a publicly available Streamlit web app that can transcribe uploaded audio files
Data Visualization with Advanced Excel
In this course, you will get hands-on instruction of advanced Excel 2013 functions. You’ll learn to use PowerPivot to build databases and data models. We’ll show you how to perform different types of scenario and simulation analysis and you’ll have an opportunity to practice these skills by leveraging some of Excel's built in tools including, solver, data tables, scenario manager and goal seek. In the second half of the course, will cover how to visualize data, tell a story and explore data by reviewing core principles of data visualization and dashboarding. You’ll use Excel to build complex graphs and Power View reports and then start to combine them into dynamic dashboards.
Note: Learners will need PowerPivot to complete some of the exercises. Please use MS Excel 2013 version. If you have other MS Excel versions or a MAC you might not be able to complete all assignments.
This course was created by PricewaterhouseCoopers LLP with an address at 300 Madison Avenue, New York, New York, 10017.
Predictive Modeling and Analytics
Welcome to the second course in the Data Analytics for Business specialization!
This course will introduce you to some of the most widely used predictive modeling techniques and their core principles. By taking this course, you will form a solid foundation of predictive analytics, which refers to tools and techniques for building statistical or machine learning models to make predictions based on data. You will learn how to carry out exploratory data analysis to gain insights and prepare data for predictive modeling, an essential skill valued in the business.
You’ll also learn how to summarize and visualize datasets using plots so that you can present your results in a compelling and meaningful way. We will use a practical predictive modeling software, XLMiner, which is a popular Excel plug-in. This course is designed for anyone who is interested in using data to gain insights and make better business decisions. The techniques discussed are applied in all functional areas within business organizations including accounting, finance, human resource management, marketing, operations, and strategic planning.
The expected prerequisites for this course include a prior working knowledge of Excel, introductory level algebra, and basic statistics.
Fitting Statistical Models to Data with Python
In this course, we will expand our exploration of statistical inference techniques by focusing on the science and art of fitting statistical models to data. We will build on the concepts presented in the Statistical Inference course (Course 2) to emphasize the importance of connecting research questions to our data analysis methods. We will also focus on various modeling objectives, including making inference about relationships between variables and generating predictions for future observations.
This course will introduce and explore various statistical modeling techniques, including linear regression, logistic regression, generalized linear models, hierarchical and mixed effects (or multilevel) models, and Bayesian inference techniques. All techniques will be illustrated using a variety of real data sets, and the course will emphasize different modeling approaches for different types of data sets, depending on the study design underlying the data (referring back to Course 1, Understanding and Visualizing Data with Python).
During these lab-based sessions, learners will work through tutorials focusing on specific case studies to help solidify the week’s statistical concepts, which will include further deep dives into Python libraries including Statsmodels, Pandas, and Seaborn. This course utilizes the Jupyter Notebook environment within Coursera.
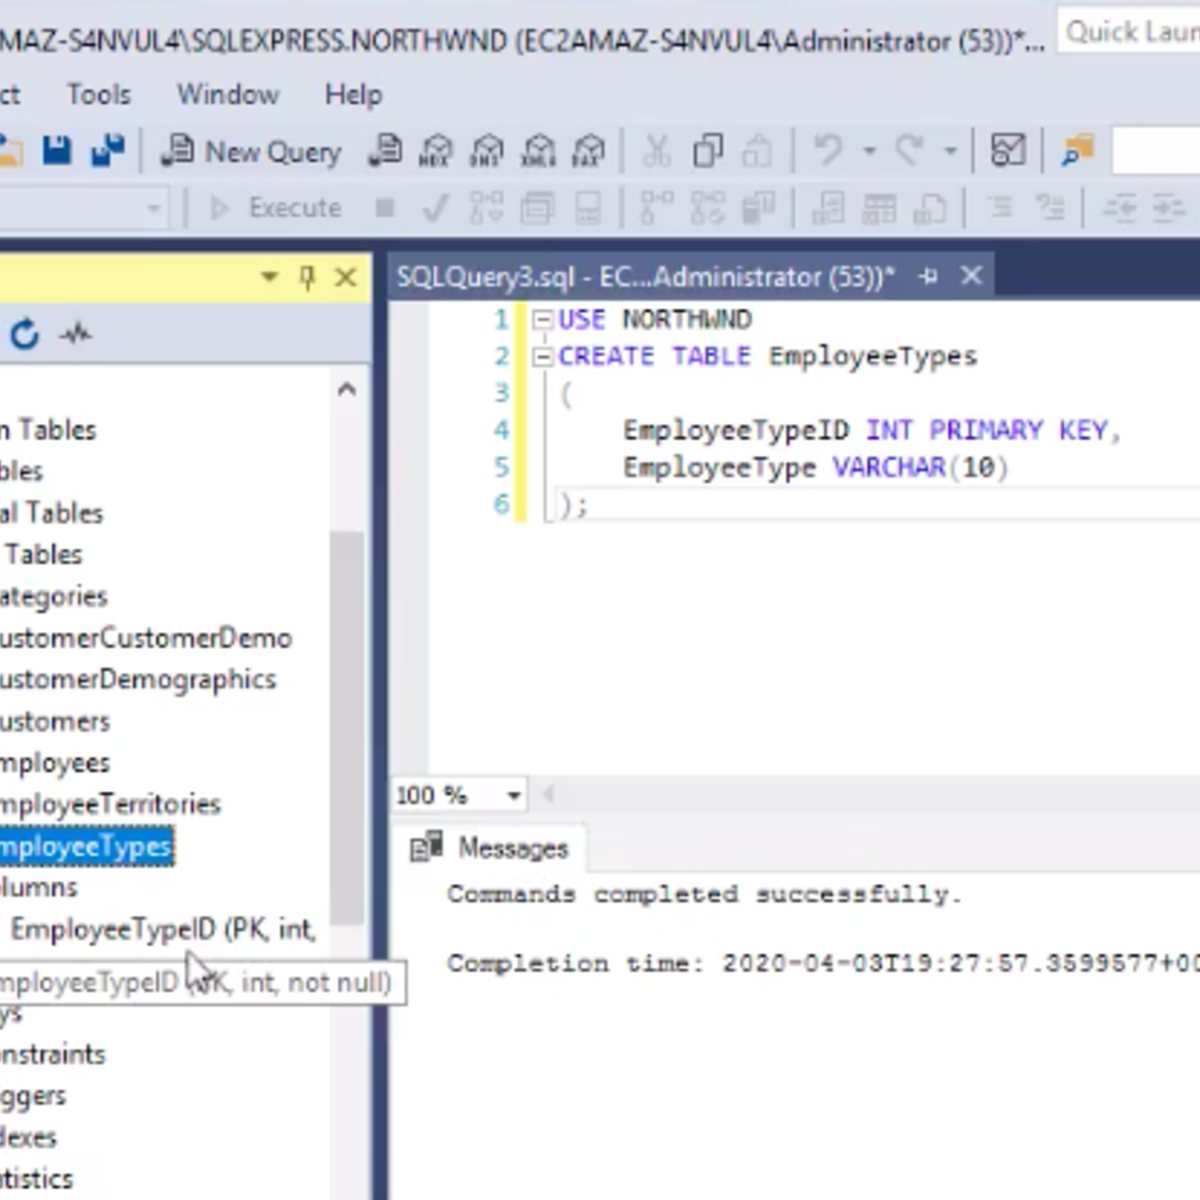
Building Basic Relational Databases in SQL Server Management Studio
In this one-hour based project you will apply the basics of working with relational databases within the SQL Server Management Studio (SSMS) environment. You will use the tools in SSMS to diagram an existing database and to create and run some SELECT and CREATE TABLE structured query language commands. You will also acquire the basic terminology that applies to all relational databases. By successfully completing the hands-on practices assigned, you will be better prepared for applying these basic concepts in SSMS in SQL Server classes.
Note: This course works best for learners who are based in the North America region. We’re currently working on providing the same experience in other regions.
Popular Internships and Jobs by Categories
Find Jobs & Internships
Browse


© 2024 BoostGrad | All rights reserved