
Back to Courses


Data Science Courses - Page 73
Showing results 721-730 of 1407
Probabilistic Graphical Models 3: Learning
Probabilistic graphical models (PGMs) are a rich framework for encoding probability distributions over complex domains: joint (multivariate) distributions over large numbers of random variables that interact with each other. These representations sit at the intersection of statistics and computer science, relying on concepts from probability theory, graph algorithms, machine learning, and more. They are the basis for the state-of-the-art methods in a wide variety of applications, such as medical diagnosis, image understanding, speech recognition, natural language processing, and many, many more. They are also a foundational tool in formulating many machine learning problems.
This course is the third in a sequence of three. Following the first course, which focused on representation, and the second, which focused on inference, this course addresses the question of learning: how a PGM can be learned from a data set of examples. The course discusses the key problems of parameter estimation in both directed and undirected models, as well as the structure learning task for directed models. The (highly recommended) honors track contains two hands-on programming assignments, in which key routines of two commonly used learning algorithms are implemented and applied to a real-world problem.
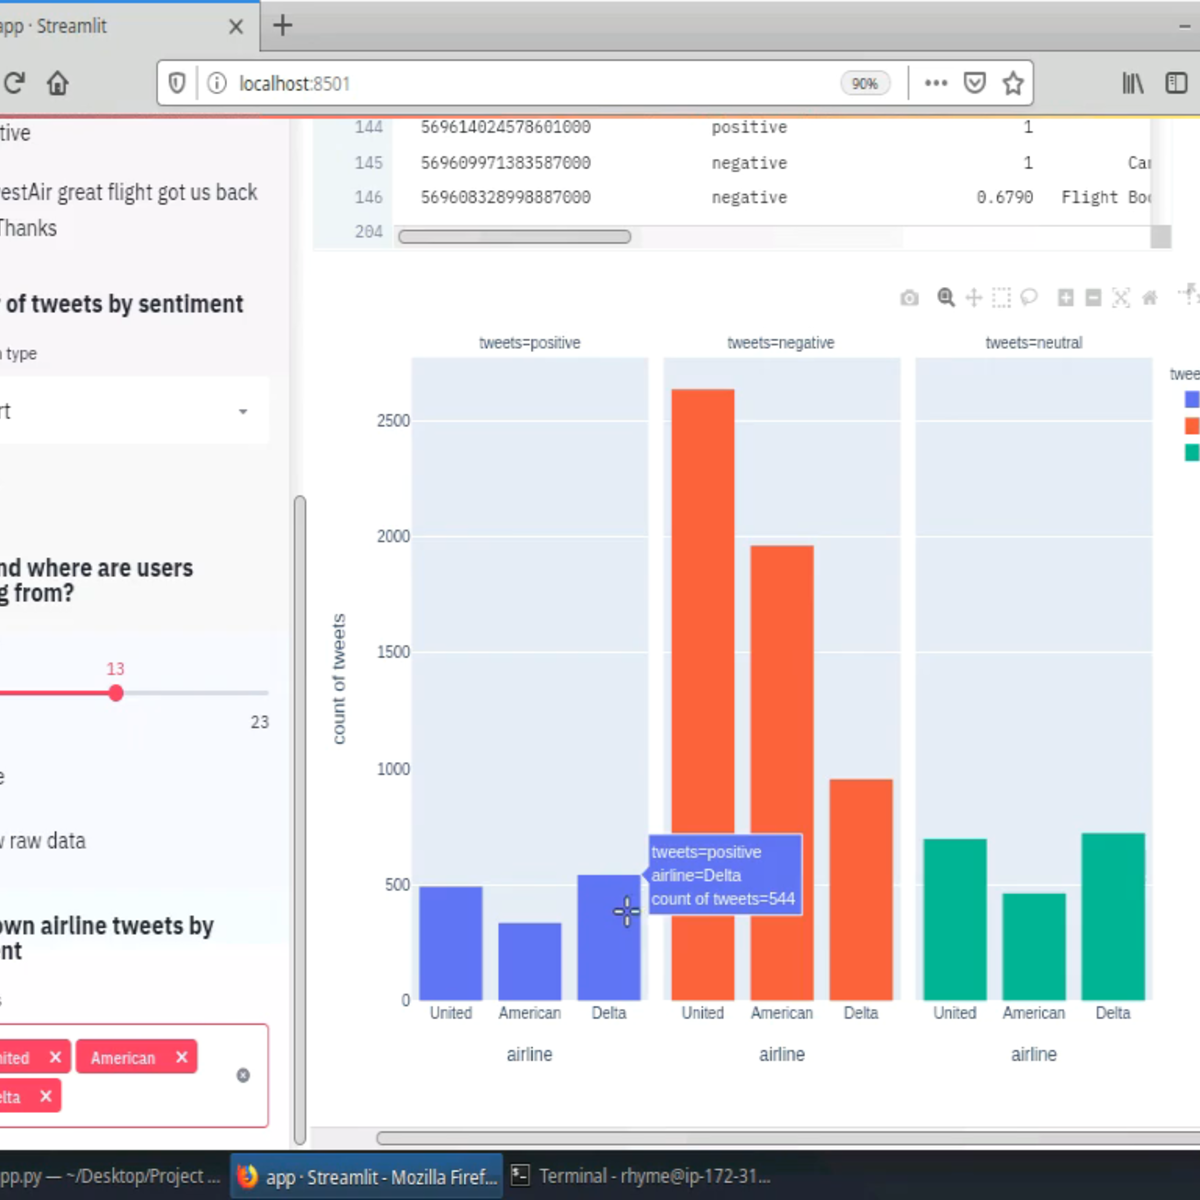
Create Interactive Dashboards with Streamlit and Python
Welcome to this hands-on project on building your first interactive, data dashboard with the Streamlit library in Python. By the end of this project, you are going to be comfortable with using Python and Streamlit to build beautiful and interactive dashboards and web apps, all with zero web development experience! We are going to load, explore, visualize and interact with data, and generate dashboards in less than 150 lines of Python code!
Prior experience with writing simple Python scripts and using pandas for data manipulation is recommended.
Note: This course works best for learners who are based in the North America region. We’re currently working on providing the same experience in other regions.
Build a Bot in Python for Basic File and Interface Chores
If your work causes you to find yourself constantly at a keyboard, then you know how tedious doing file system chores can be. From organizing files into folders, whether by file type, attributes, or simply alphabetically or by month, all of these tasks consume our time and increase the time required by other tasks. Yet, without organizing, searching for the correct files can steal just as much time.
What if you had a friend to help you out? In this project, I will show you step-by-step how to code an AI assistant that can accept simple commands and help you keep organized. By the time you're finished, you'll have a working prototype of a file helper bot that from the get-go will have the ability to clean and organize your files and folders the way you ask it to, combine text files into PDFs, search for files based on parameters set by you, and even search Google for answers. Your assistant will also be fully expandable, so you can write new methods to teach it new tasks!
Note: This course works best for learners who are based in the North America region. We’re currently working on providing the same experience in other regions.
Troubleshooting Common SQL Errors with BigQuery
This is a self-paced lab that takes place in the Google Cloud console. In this lab, you use BigQuery to troubleshoot common SQL errors, query the data-to-insights public dataset, use the Query Validator, and troubleshoot syntax and logical SQL errors.
تحليل البيانات باستخدام البرمجة R
هذه هي الدورة التدريبية السابعة في شهادة تحليلات البيانات من Google. ستزودك هذه الدورات بالمهارات اللازمة للتقدم لوظائف محلل البيانات على المستوى التمهيدي. في هذه الدورة، ستتعرف على لغة البرمجة المعروفة باسم R. حيث ستتعرف على كيفية استخدام RStudio، وهي البيئة التي تتيح لك استخدام R. كما ستتناول هذه الدورة أيضًا تطبيقات البرامج والأدوات التي تنفرد بها R، مثل حزم R. ستكتشف كيف تتيح لك لغة R تنظيف البيانات وتنظيمها وتحليلها وتصورها والإبلاغ عنها بطرق جديدة وأكثر فاعلية. سيستمر محللو بيانات Google الحاليون بإرشادك وتزويدك بالطرق العملية لإنجاز مهام محلل البيانات الشائعة باستخدام أفضل الأدوات والموارد.
سيتم تجهيز المتعلمين الذين يكملون برنامج الشهادة هذا للتقدم لوظائف المستوى التمهيدي كمحللين بيانات. لا تلزم خبرة سابقة.
بنهاية هذه الدورة، ستكون قادرًا على:
- فحص فوائد استخدام لغة البرمجة R.
- اكتشاف كيفية استخدام RStudio لتطبيق R على تحليلك.
- استكشاف المفاهيم الأساسية المرتبطة بالبرمجة في R.
- استكشاف محتويات ومكونات حزم R بما في ذلك حزمة Tidyverse.
- اكتساب فهم لأطر البيانات واستخدامها في R.
- اكتشاف خيارات إنشاء التصورات في R.
- التعرف على R Markdown لتوثيق برمجة R.
Creating a Budget with Microsoft Excel
By the end of this project, you will learn how to create a budget template in an Excel Spreadsheet by using a free version of Microsoft Office Excel.
Excel is a spreadsheet that is similar in layout as accounting spreadsheets. It consists of individual cells that can be used to build functions, formulas, tables, and graphs that easily organize and analyze large amounts of information and data. While a budget helps you stay within estimated costs and expenses for either a business or a family. We will learn to create a budget both automatically and manually, step by step. By utilizing Microsoft Excel you will reduce the burden of budgeting and see increase in accuracy. It will allow you to scale budgeting and to make record keeping and tracking of expenditures easier. We will also use basic graphing for presenting budget tracking. You do not need to be an advance user of Microsoft Excel as we will show you how to use templates that are provided in the program and simple formulas to create a budget for any reason.
The R Programming Environment
This course provides a rigorous introduction to the R programming language, with a particular focus on using R for software development in a data science setting. Whether you are part of a data science team or working individually within a community of developers, this course will give you the knowledge of R needed to make useful contributions in those settings. As the first course in the Specialization, the course provides the essential foundation of R needed for the following courses. We cover basic R concepts and language fundamentals, key concepts like tidy data and related "tidyverse" tools, processing and manipulation of complex and large datasets, handling textual data, and basic data science tasks. Upon completing this course, learners will have fluency at the R console and will be able to create tidy datasets from a wide range of possible data sources.
Optimize TensorFlow Models For Deployment with TensorRT
This is a hands-on, guided project on optimizing your TensorFlow models for inference with NVIDIA's TensorRT. By the end of this 1.5 hour long project, you will be able to optimize Tensorflow models using the TensorFlow integration of NVIDIA's TensorRT (TF-TRT), use TF-TRT to optimize several deep learning models at FP32, FP16, and INT8 precision, and observe how tuning TF-TRT parameters affects performance and inference throughput.
Prerequisites:
In order to successfully complete this project, you should be competent in Python programming, understand deep learning and what inference is, and have experience building deep learning models in TensorFlow and its Keras API.
Note: This course works best for learners who are based in the North America region. We’re currently working on providing the same experience in other regions.
Generate Synthetic Images with DCGANs in Keras
In this hands-on project, you will learn about Generative Adversarial Networks (GANs) and you will build and train a Deep Convolutional GAN (DCGAN) with Keras to generate images of fashionable clothes. We will be using the Keras Sequential API with Tensorflow 2 as the backend.
In our GAN setup, we want to be able to sample from a complex, high-dimensional training distribution of the Fashion MNIST images. However, there is no direct way to sample from this distribution. The solution is to sample from a simpler distribution, such as Gaussian noise. We want the model to use the power of neural networks to learn a transformation from the simple distribution directly to the training distribution that we care about. The GAN consists of two adversarial players: a discriminator and a generator. We’re going to train the two players jointly in a minimax game theoretic formulation.
This course runs on Coursera's hands-on project platform called Rhyme. On Rhyme, you do projects in a hands-on manner in your browser. You will get instant access to pre-configured cloud desktops containing all of the software and data you need for the project. Everything is already set up directly in your internet browser so you can just focus on learning. For this project, you’ll get instant access to a cloud desktop with Python, Jupyter, and Keras pre-installed.
Notes:
- You will be able to access the cloud desktop 5 times. However, you will be able to access instructions videos as many times as you want.
- This course works best for learners who are based in the North America region. We’re currently working on providing the same experience in other regions.
Master the Art of Data Visualization With Tableau Public
Tableau is widely recognized as one of the premier data visualization software programs. For many years access to the program was limited to those who purchased licenses. Recently, Tableau launched a public version that grants the ability to create amazing data visualizations for free. Account members can also share and join projects to collaborate on projects that can change the world.
By the end of this project, we will learn how to create an account, create visualizations, and how to share visualizations with others.
Note: This course works best for learners who are based in the North America region. We’re currently working on providing the same experience in other regions.
Popular Internships and Jobs by Categories
Browse
© 2024 BoostGrad | All rights reserved