Back to Courses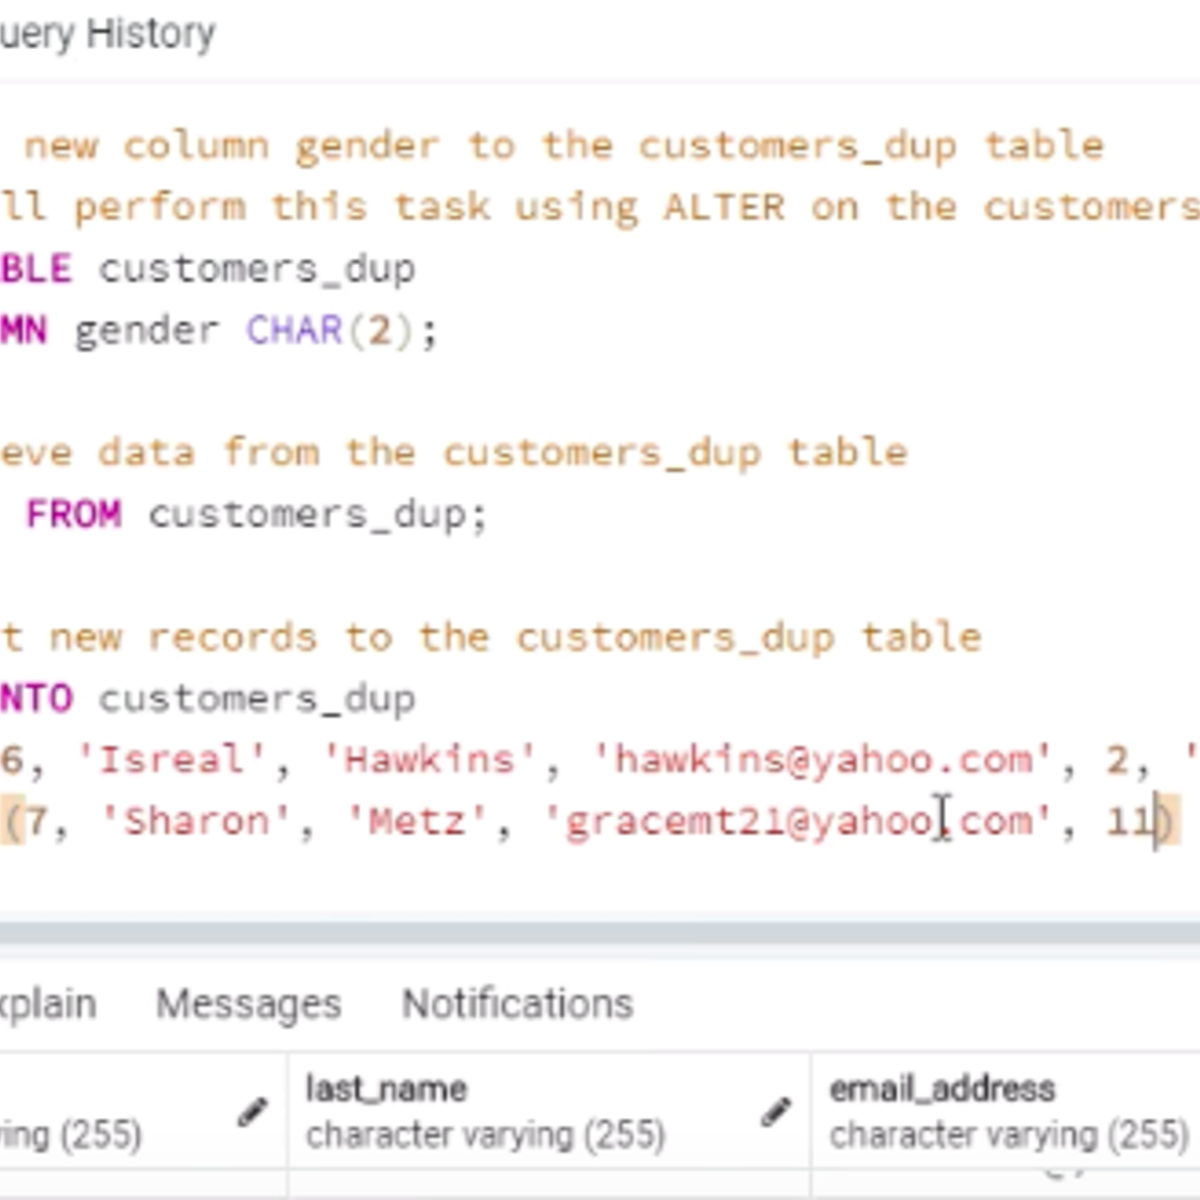


Data Science Courses - Page 63
Showing results 621-630 of 1407
Performing Data Definition and Manipulation in SQL
In this 2-hour long project-based course, you will learn how to use SQL data definition statements for various data definition tasks and how to use SQL data manipulation statements for data manipulation tasks such as updating records in a table. In addition, you will learn how to upload a CSV file into a database using PostgreSQL.
Importing Data into R
In this 1-hour long project-based course, you will learn how to read all sorts of data and import them into R, including CSV files, Excel files, data from other statistical software, the web and from relational databases.
Note: This course works best for learners who are based in the North America region. We’re currently working on providing the same experience in other regions.
Net Promoter Score (NPS) and Sentiment Analysis in Miro
By the end of this project, you will be able to confidently analyze survey data by generating Net Promoter Score analytics to help understand and communicate the state of the overall Customer Experience (CX).
To do this, you will gain hands-on experience leveraging the visualization tools in the Miro online visual collaboration platform for teamwork.
Note: This course works best for learners who are based in the North America region. We’re currently working on providing the same experience in other regions.
Data Storage in Microsoft Azure for Associate Developers
Azure provides a variety of ways to store data: unstructured, archival, relational, and more. In this course, you will learn the basics of storage management in Azure, how to create a Storage Account, and how to choose the right model for the data you want to store in the cloud.
This course part of a Specialization intended for Data engineers and developers who want to demonstrate their expertise in designing and implementing data solutions that use Microsoft Azure data services anyone interested in preparing for the Exam DP-203: Data Engineering on Microsoft Azure (beta).
This is the second in a program of 10 courses to help prepare you to take the exam so that you can have expertise in designing and implementing data solutions that use Microsoft Azure data services. The Data Engineering on Microsoft Azure exam is an opportunity to prove knowledge expertise in integrating, transforming, and consolidating data from various structured and unstructured data systems into structures that are suitable for building analytics solutions that use Microsoft Azure data services. Each course teaches you the concepts and skills that are measured by the exam.
By the end of this Professional Certificate program, you will be ready to take and sign-up for the Exam DP-203: Data Engineering on Microsoft Azure (beta).
Text Generation with Markov Chains in Python
In this project-based course, you will learn about Markov chains and use them to build a probabilistic model of an entire book’s text. This will be done from first principles, without libraries.
Markov chains are a simple but fundamental approach to modeling stochastic processes, with many practical applications. By the end of this project, you will have generated a random new text based on the book you modeled, using code you wrote in Python.
Introduction to Microsoft Azure Synapse Analytics
In this course, you will learn how Azure Synapse Analytics enables you to perform different types of analytics through its’ components that can be used to build Modern Data Warehouses through to advanced analytical solutions. You will learn how Azure Synapse Analytics solves the issue of having a single service to fulfill the broad range of analytics requirements that organizations face today and take a tour of the core application used to interact with the various components of Azure Synapse Analytics. You will learn the various components of Azure Synapse Analytics that enable you to build your analytical solutions in one place.
This course is part of a Specialization intended for Data engineers and developers who want to demonstrate their expertise in designing and implementing data solutions that use Microsoft Azure data services for anyone interested in preparing for the Exam DP-203: Data Engineering on Microsoft Azure (beta).
This is the fourth course in a program of 10 courses to help prepare you to take the exam so that you can have expertise in designing and implementing data solutions that use Microsoft Azure data services. The Data Engineering on Microsoft Azure exam is an opportunity to prove knowledge expertise in integrating, transforming, and consolidating data from various structured and unstructured data systems into structures that are suitable for building analytics solutions that use Microsoft Azure data services. Each course teaches you the concepts and skills that are measured by the exam.
By the end of this Specialization, you will be ready to take and sign-up for the Exam DP-203: Data Engineering on Microsoft Azure (beta).
Linux and Bash for Data Engineering
In this second course of the Python, Bash and SQL Essentials for Data Engineering Specialization, you will learn the fundamentals of Linux necessary to perform data engineering tasks. Additionally, you will explore how to use both Bash and zsh configurations, and develop the syntax needed to interact and control Linux. These skills will allow you to manage and manipulate databases in a Bash environment.
PyCaret: Anatomy of Regression
In this 2 hour and 15 mins long project-based course, you will learn how to ow to set up PyCaret Environment and become familiar with the variety of data preparing tasks done during setup, be able to create, see and compare the performance of several models, learn how to tune your model without doing an exhaustive search, create impressive visuals of models, interpret models with the wrapper around SHAP Library and much more & all this with just a few lines of code.
Note: This project works best for learners who are based in the North America region. We’re currently working on providing the same experience in other regions.
Data Visualization using Plotly
Welcome to this 1 hour long guided project on Data Visualization using Plotly. Plotly is a python graphing library which is used to make interactive, publication-quality graphs. It allows users to import, copy and paste, or stream data to be analyzed and visualized.
In this project you will learn how to create beautiful visualizations using Plotly constructs. This guided project is for anyone who wants to learn data visualization or already in the data science field.
Address Business Issues with Data Science
This course is designed for business professionals that want to learn how to determine if a business issue is appropriate for a data science project and apply the data science process.
The typical student in this course will have experience in a business setting and a high-level understanding of fundamental data science concepts, including, but not limited to: types of data, data science roles, the overall data science lifecycle, and the benefits and challenges of data science.
Popular Internships and Jobs by Categories
Find Jobs & Internships
Browse


© 2024 BoostGrad | All rights reserved