Back to Courses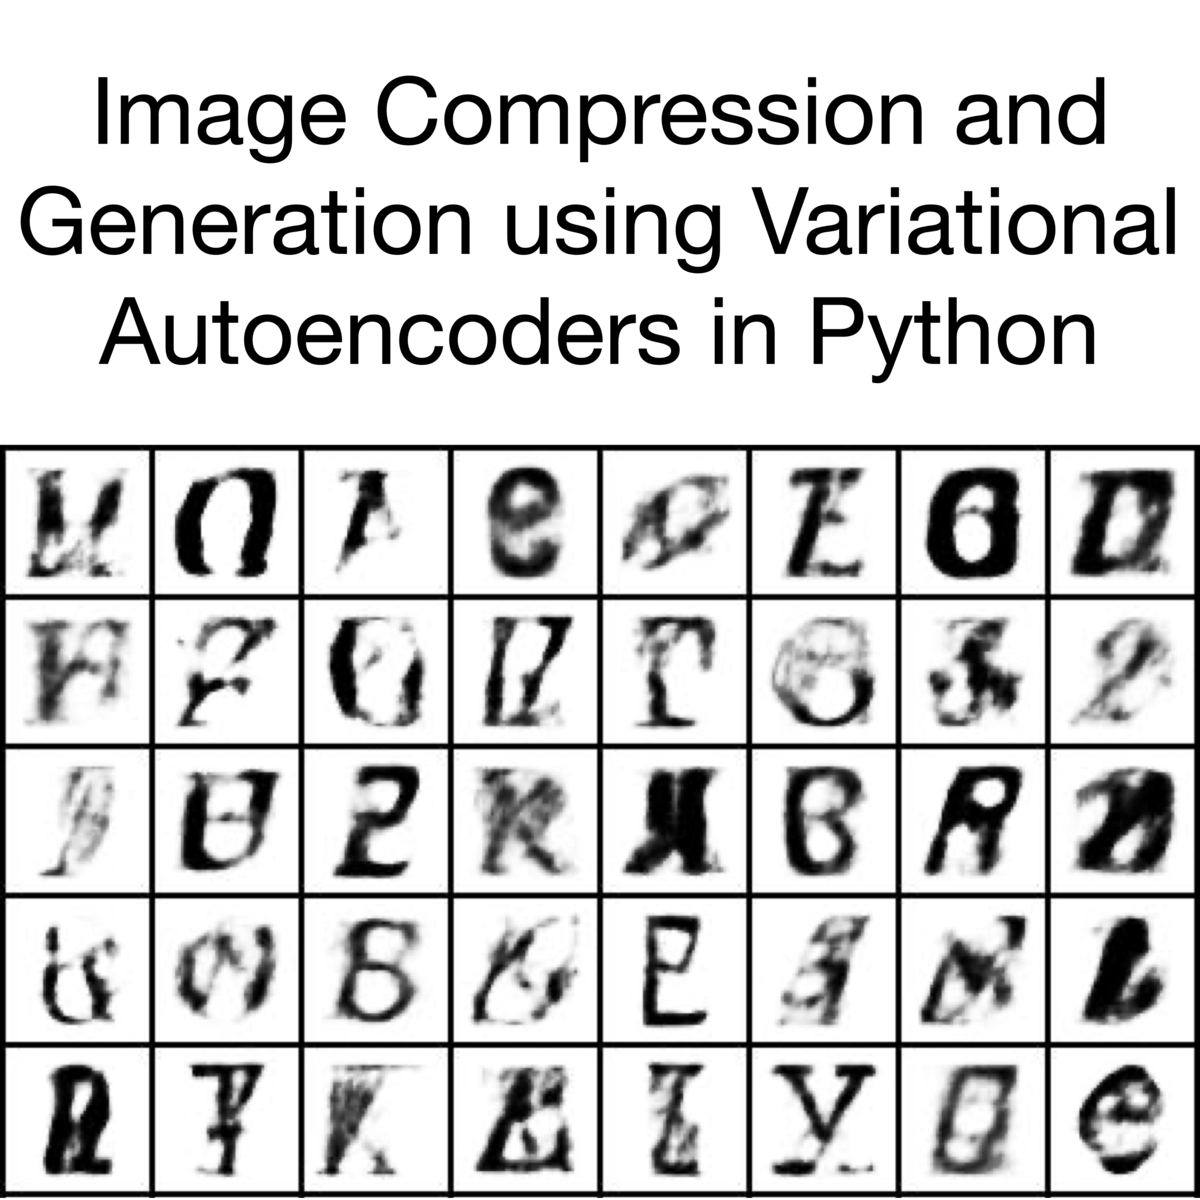


Data Science Courses - Page 59
Showing results 581-590 of 1407
Image Compression and Generation using Variational Autoencoders in Python
In this 1-hour long project, you will be introduced to the Variational Autoencoder. We will discuss some basic theory behind this model, and move on to creating a machine learning project based on this architecture. Our data comprises 60.000 characters from a dataset of fonts. We will train a variational autoencoder that will be capable of compressing this character font data from 2500 dimensions down to 32 dimensions. This same model will be able to then reconstruct its original input with high fidelity. The true advantage of the variational autoencoder is its ability to create new outputs that come from distributions that closely follow its training data: we can output characters in brand new fonts.
Note: This course works best for learners who are based in the North America region. We’re currently working on providing the same experience in other regions.
Executive Data Science Capstone
The Executive Data Science Capstone, the specialization’s culminating project, is an opportunity for people who have completed all four EDS courses to apply what they've learned to a real-world scenario developed in collaboration with Zillow, a data-driven online real estate and rental marketplace, and DataCamp, a web-based platform for data science programming. Your task will be to lead a virtual data science team and make key decisions along the way to demonstrate that you have what it takes to shepherd a complex analysis project from start to finish. For the final project, you will prepare and submit a presentation, which will be evaluated and graded by your fellow capstone participants.
Course cover image by Luckey_sun. Creative Commons BY-SA https://flic.kr/p/bx1jvU
Using ggplot
In this project, you will learn about using ggplot, specifically ggplot2 (the latest version of ggplot). This program is a plotting package for the programming language R. R is a computer programming language, and it is also an open-source software often used among data scientists, statisticians, and data miners in their everyday work with data sets. The gg in ggplot2 means Grammar of Graphics, a graphic concept which describes plots by using a “grammar.”
Note: This course works best for learners who are based in the North America region. We’re currently working on providing the same experience in other regions.
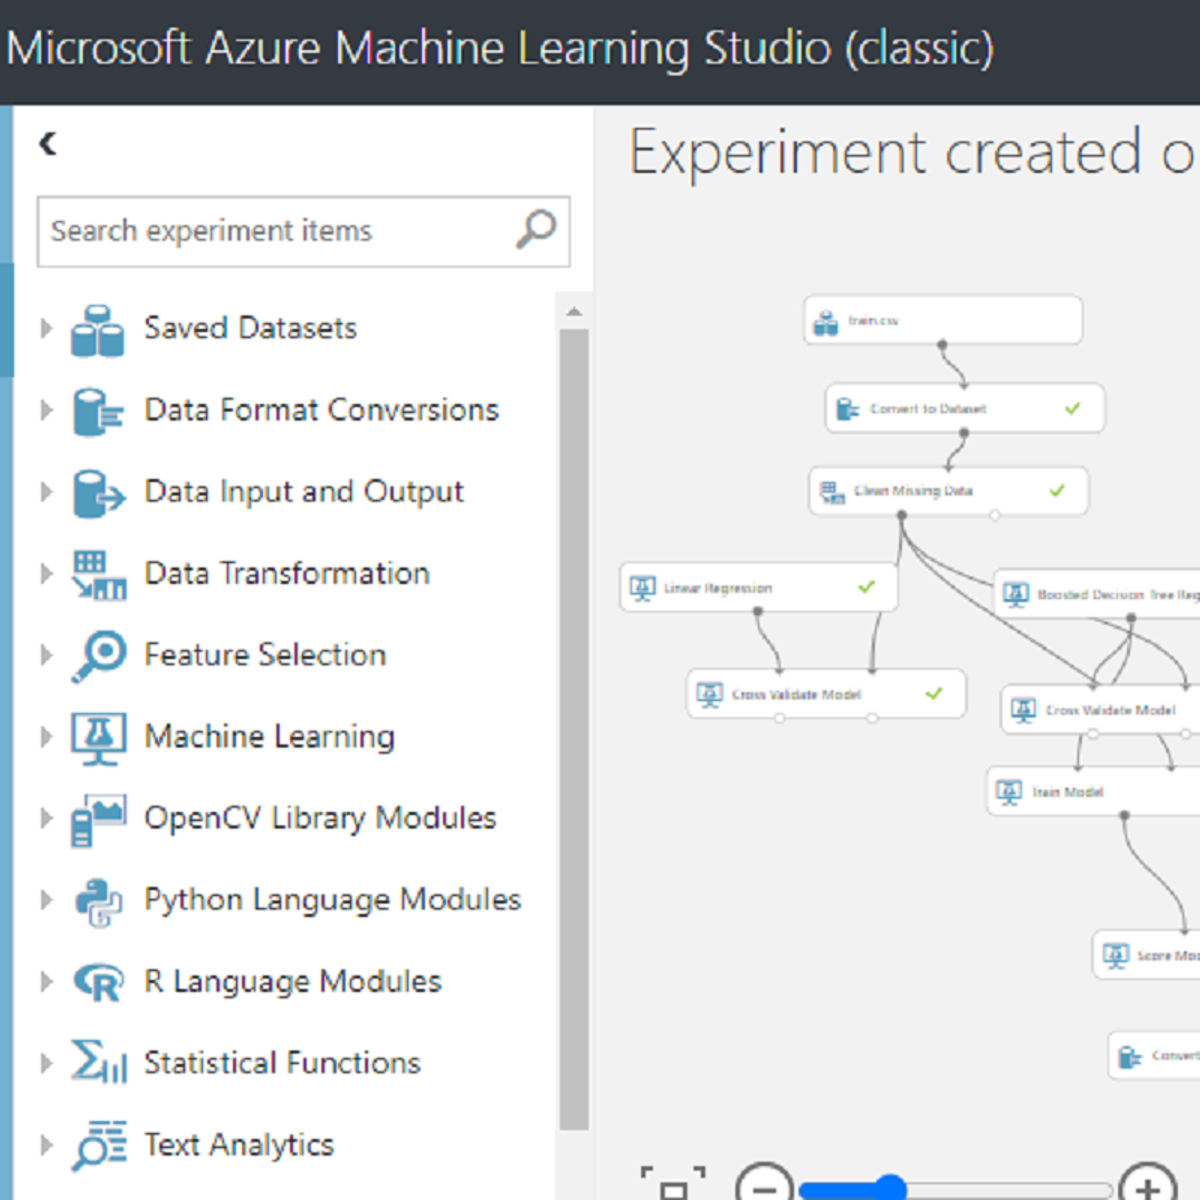
How to Use Microsoft Azure ML Studio for Kaggle Competitions
In this 90 minutes long project-based course, you will learn how to create a Microsoft Azure ML Studio account, a Kaggle account for competitions and use both of them to build a machine learning model which we will be using to make predictions.
Note: This course works best for learners who are based in the North America region. We’re currently working on providing the same experience in other regions.
Advanced Business Analytics Capstone
The analytics process is a collection of interrelated activities that lead to better decisions and to a higher business performance. The capstone of this specialization is designed with the goal of allowing you to experience this process. The capstone project will take you from data to analysis and models, and ultimately to presentation of insights.
In this capstone project, you will analyze the data on financial loans to help with the investment decisions of an investment company. You will go through all typical steps of a data analytics project, including data understanding and cleanup, data analysis, and presentation of analytical results.
For the first week, the goal is to understand the data and prepare the data for analysis. As we discussed in this specialization, data preprocessing and cleanup is often the first step in data analytics projects. Needless to say, this step is crucial for the success of this project.
In the second week, you will perform some predictive analytics tasks, including classifying loans and predicting losses from defaulted loans. You will try a variety of tools and techniques this week, as the predictive accuracy of different tools can vary quite a bit. It is rarely the case that the default model produced by ASP is the best model possible. Therefore, it is important for you to tune the different models in order to improve the performance.
Beginning in the third week, we turn our attention to prescriptive analytics, where you will provide some concrete suggestions on how to allocate investment funds using analytics tools, including clustering and simulation based optimization. You will see that allocating funds wisely is crucial for the financial return of the investment portfolio.
In the last week, you are expected to present your analytics results to your clients. Since you will obtain many results in your project, it is important for you to judiciously choose what to include in your presentation. You are also expected to follow the principles we covered in the courses in preparing your presentation.
AI Fundamentals for Non-Data Scientists
In this course, you will go in-depth to discover how Machine Learning is used to handle and interpret Big Data. You will get a detailed look at the various ways and methods to create algorithms to incorporate into your business with such tools as Teachable Machine and TensorFlow. You will also learn different ML methods, Deep Learning, as well as the limitations but also how to drive accuracy and use the best training data for your algorithms. You will then explore GANs and VAEs, using your newfound knowledge to engage with AutoML to help you start building algorithms that work to suit your needs. You will also see exclusive interviews with industry leaders, who manage Big Data for companies such as McDonald's and Visa. By the end of this course, you will have learned different ways to code, including how to use no-code tools, understand Deep Learning, how to measure and review errors in your algorithms, and how to use Big Data to not only maintain customer privacy but also how to use this data to develop different strategies that will drive your business.
Managing Big Data in Clusters and Cloud Storage
In this course, you'll learn how to manage big datasets, how to load them into clusters and cloud storage, and how to apply structure to the data so that you can run queries on it using distributed SQL engines like Apache Hive and Apache Impala. You’ll learn how to choose the right data types, storage systems, and file formats based on which tools you’ll use and what performance you need.
By the end of the course, you will be able to
• use different tools to browse existing databases and tables in big data systems;
• use different tools to explore files in distributed big data filesystems and cloud storage;
• create and manage big data databases and tables using Apache Hive and Apache Impala; and
• describe and choose among different data types and file formats for big data systems.
To use the hands-on environment for this course, you need to download and install a virtual machine and the software on which to run it. Before continuing, be sure that you have access to a computer that meets the following hardware and software requirements:
• Windows, macOS, or Linux operating system (iPads and Android tablets will not work)
• 64-bit operating system (32-bit operating systems will not work)
• 8 GB RAM or more
• 25GB free disk space or more
• Intel VT-x or AMD-V virtualization support enabled (on Mac computers with Intel processors, this is always enabled;
on Windows and Linux computers, you might need to enable it in the BIOS)
• For Windows XP computers only: You must have an unzip utility such as 7-Zip or WinZip installed (Windows XP’s built-in unzip utility will not work)
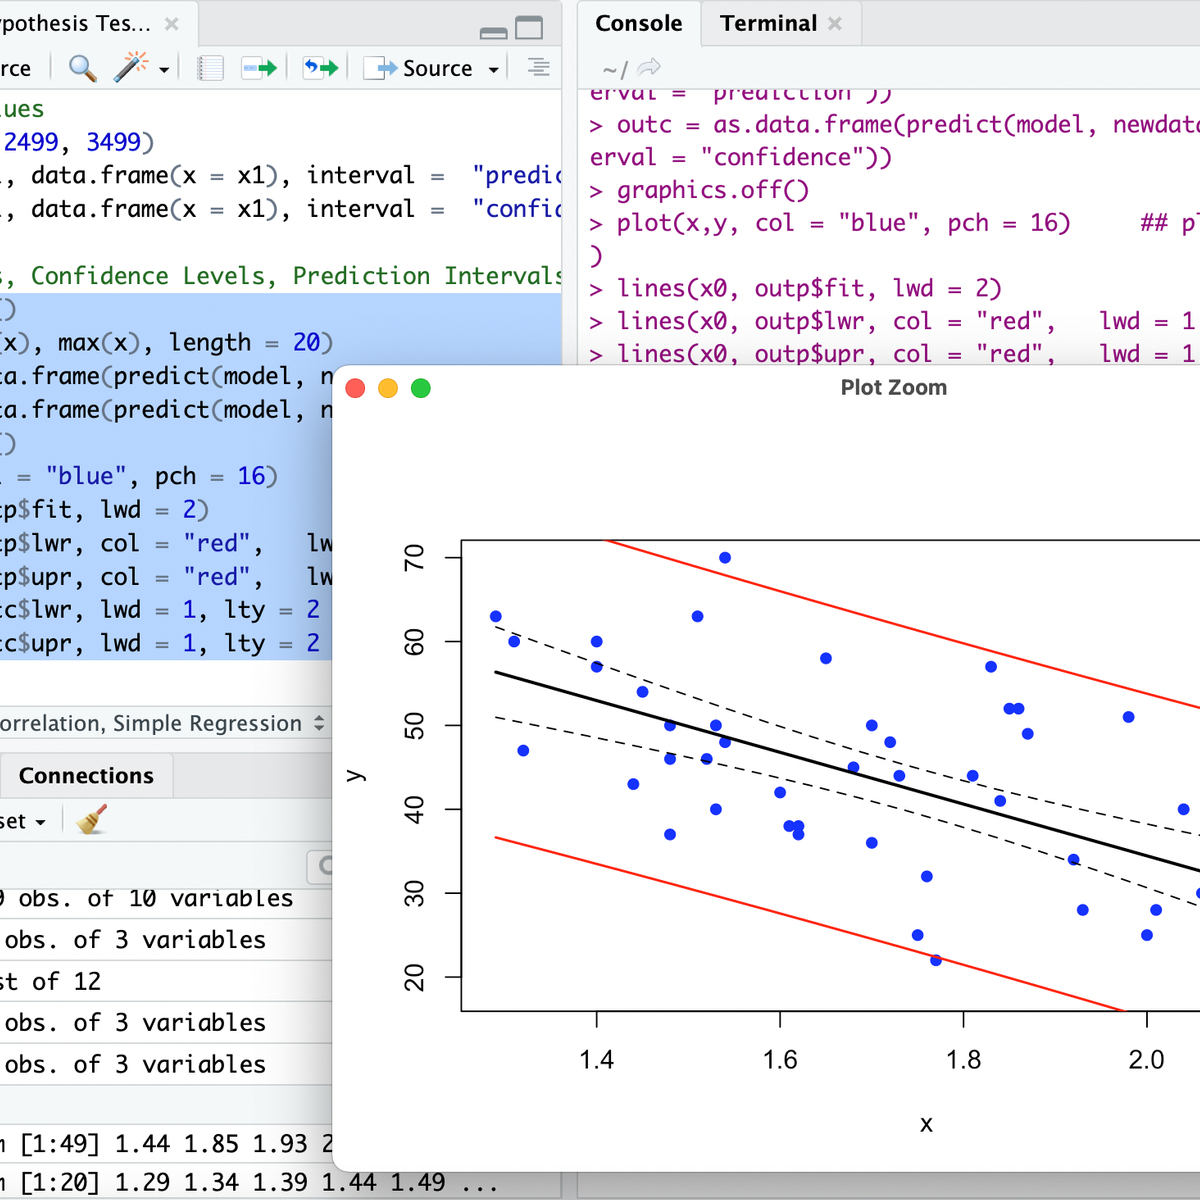
RStudio for Six Sigma - Hypothesis Testing
Welcome to RStudio for Six Sigma - Hypothesis Testing. This is a project-based course which should take approximately 2 hours to finish. Before diving into the project, please take a look at the course objectives and structure.
By the end of this project, you will learn to identify data types (continuous vs discrete), understand what is Hypothesis Testing, pick the right Hypothesis Testing tool, perform various Hypothesis Tests including Correlation, Simple Regression, Logistic Regression, Chi-Square Test, T-Tests, Analysis of Variance (ANOVA), and Non-Parametric tests such as Wilcoxon Rank Sum and Kruskal Wallis.
Getting started with ImageJ
At the end of this project, you will learn how to use download and get started with ImageJ and how to use the main commands of this software for image processing and analysis, among other scientific.
This guided project is for people interested in image analysis, such as determining the number or size of objects in an image, for scientific or personal reasons.
ImageJ is a free downloadable online software that offers a very wide variety of tools for image processing and can be particularly effective for scientific analysis.
After completing this project, you will have access to the ImageJ software, and you will be able to use the basic functions to analyze images and detect for example the number and size of objects in an image. ImageJ is simple, free software that provides all the tools you need to process and analyze all of your images. The software is very easy to use and offers a very impressive analysis capacity!
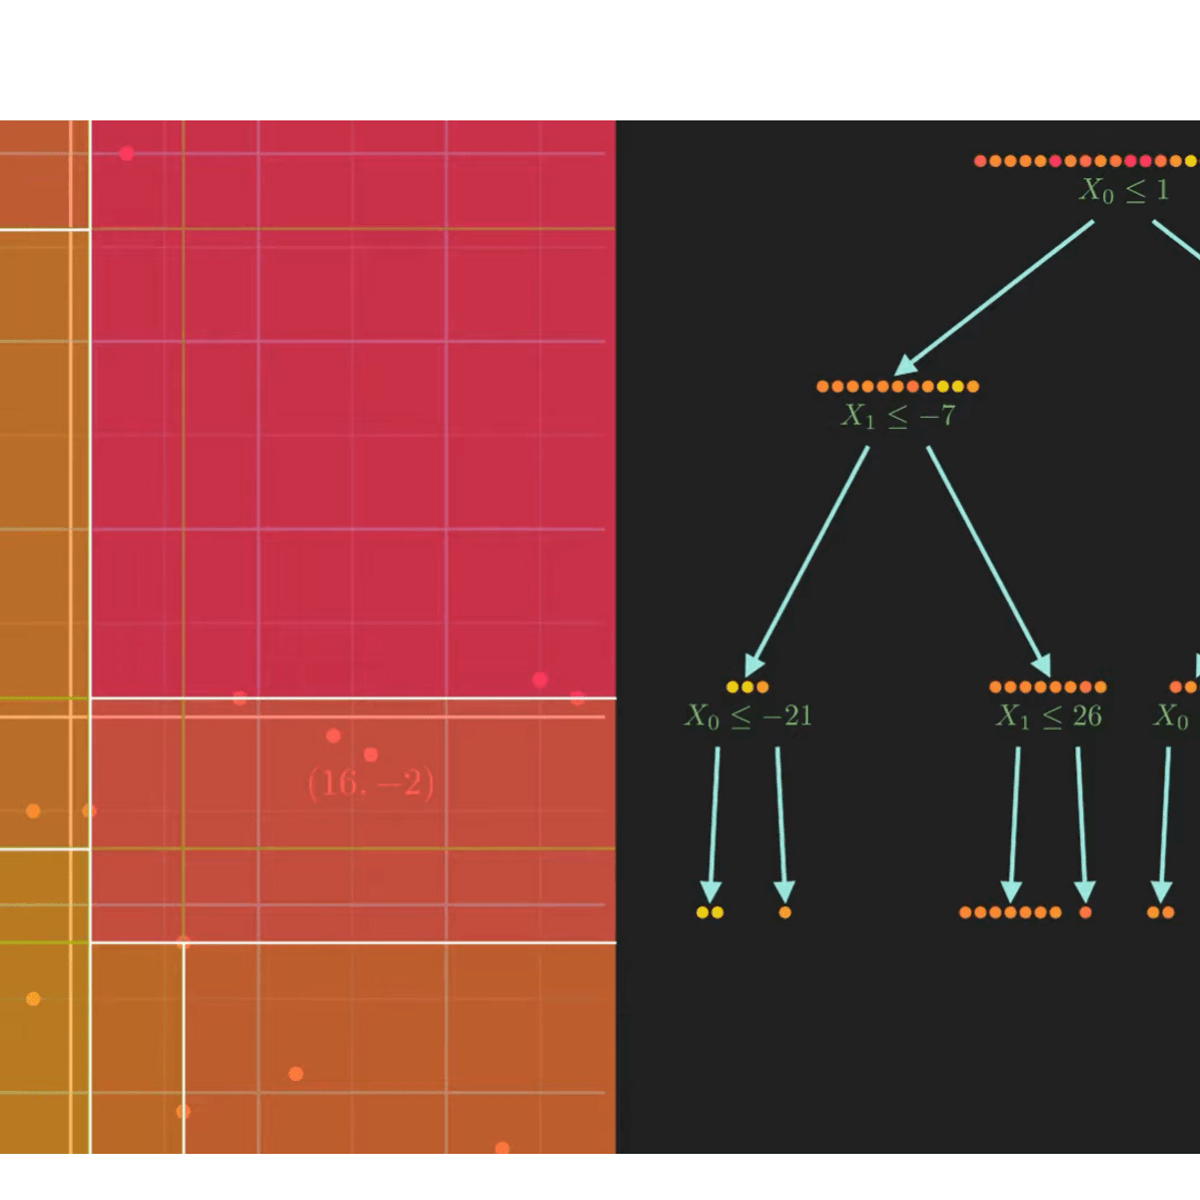
Performing regression tasks using decision tree & PCA basics
In this 1-hour long project-based course, you will learn how to perform regression tasks using decision tree & some PCA fundamental coding.
you will get expertise in acing following tasks-
Predicting two decision tree regression model
Drawing Decision tree for regression
Regularize a decision tree regressor
Setting up the environment for dimensional reduction
Coding for Projection methods in Dimensionality reduction
Coding for PCA using SVD decomposition and SCIKIT learn
Popular Internships and Jobs by Categories
Find Jobs & Internships
Browse


© 2024 BoostGrad | All rights reserved