Back to Courses


Data Science Courses - Page 52
Showing results 511-520 of 1407
Sequences, Time Series and Prediction
If you are a software developer who wants to build scalable AI-powered algorithms, you need to understand how to use the tools to build them. This Specialization will teach you best practices for using TensorFlow, a popular open-source framework for machine learning.
In this fourth course, you will learn how to build time series models in TensorFlow. You’ll first implement best practices to prepare time series data. You’ll also explore how RNNs and 1D ConvNets can be used for prediction. Finally, you’ll apply everything you’ve learned throughout the Specialization to build a sunspot prediction model using real-world data!
The Machine Learning course and Deep Learning Specialization from Andrew Ng teach the most important and foundational principles of Machine Learning and Deep Learning. This new deeplearning.ai TensorFlow Specialization teaches you how to use TensorFlow to implement those principles so that you can start building and applying scalable models to real-world problems. To develop a deeper understanding of how neural networks work, we recommend that you take the Deep Learning Specialization.
Hypothesis Testing with Python and Excel
In today's job market, leaders need to understand the fundamentals of data to be competitive. An essential procedure to understand business and analytics is hypothesis testing. This short course, designed by Tufts University expert faculty, will teach the fundamentals of hypothesis testing of a population mean and a population proportion, using Excel and Python for calculations. You'll also discover the central limit theorem, which is essential for hypothesis testing. To conclude the course, you will apply your newfound skills by creating a plan for an experiment in your own workplace that uses hypothesis testing.
Data Science with R - Capstone Project
In this capstone course, you will apply various data science skills and techniques that you have learned as part of the previous courses in the IBM Data Science with R Specialization or IBM Data Analytics with Excel and R Professional Certificate.
For this project, you will assume the role of a Data Scientist who has recently joined an organization and be presented with a challenge that requires data collection, analysis, basic hypothesis testing, visualization, and modeling to be performed on real-world datasets. You will collect and understand data from multiple sources, conduct data wrangling and preparation with Tidyverse, perform exploratory data analysis with SQL, Tidyverse and ggplot2, model data with linear regression, create charts and plots to visualize the data, and build an interactive dashboard.
The project will culminate with a presentation of your data analysis report, with an executive summary for the various stakeholders in the organization.
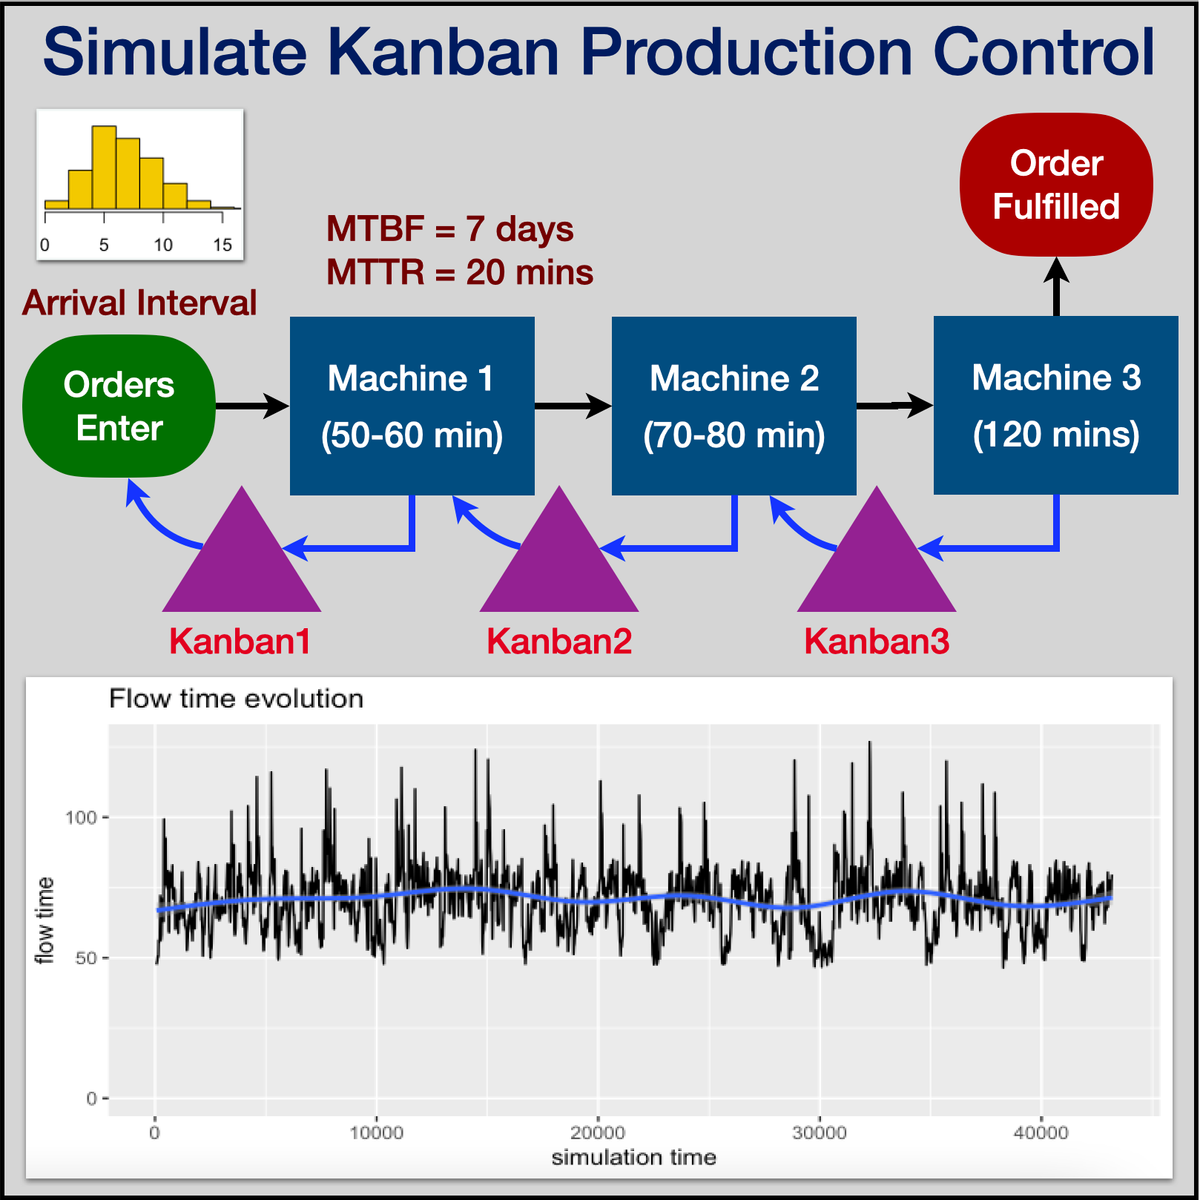
Simulation of KANBAN Production Control Using R Simmer
Understand Kanban Production Control
Model Discrete Event Simulations Using R Simmer
Capture Simulation Data, Plot Charts & Interpret Results
Communicating Data Science Results
Important note: The second assignment in this course covers the topic of Graph Analysis in the Cloud, in which you will use Elastic MapReduce and the Pig language to perform graph analysis over a moderately large dataset, about 600GB. In order to complete this assignment, you will need to make use of Amazon Web Services (AWS). Amazon has generously offered to provide up to $50 in free AWS credit to each learner in this course to allow you to complete the assignment. Further details regarding the process of receiving this credit are available in the welcome message for the course, as well as in the assignment itself. Please note that Amazon, University of Washington, and Coursera cannot reimburse you for any charges if you exhaust your credit.
While we believe that this assignment contributes an excellent learning experience in this course, we understand that some learners may be unable or unwilling to use AWS. We are unable to issue Course Certificates for learners who do not complete the assignment that requires use of AWS. As such, you should not pay for a Course Certificate in Communicating Data Results if you are unable or unwilling to use AWS, as you will not be able to successfully complete the course without doing so.
Making predictions is not enough! Effective data scientists know how to explain and interpret their results, and communicate findings accurately to stakeholders to inform business decisions. Visualization is the field of research in computer science that studies effective communication of quantitative results by linking perception, cognition, and algorithms to exploit the enormous bandwidth of the human visual cortex. In this course you will learn to recognize, design, and use effective visualizations.
Just because you can make a prediction and convince others to act on it doesn’t mean you should. In this course you will explore the ethical considerations around big data and how these considerations are beginning to influence policy and practice. You will learn the foundational limitations of using technology to protect privacy and the codes of conduct emerging to guide the behavior of data scientists. You will also learn the importance of reproducibility in data science and how the commercial cloud can help support reproducible research even for experiments involving massive datasets, complex computational infrastructures, or both.
Learning Goals: After completing this course, you will be able to:
1. Design and critique visualizations
2. Explain the state-of-the-art in privacy, ethics, governance around big data and data science
3. Use cloud computing to analyze large datasets in a reproducible way.
Introduction to Statistics
Stanford's "Introduction to Statistics" teaches you statistical thinking concepts that are essential for learning from data and communicating insights. By the end of the course, you will be able to perform exploratory data analysis, understand key principles of sampling, and select appropriate tests of significance for multiple contexts. You will gain the foundational skills that prepare you to pursue more advanced topics in statistical thinking and machine learning.
Topics include Descriptive Statistics, Sampling and Randomized Controlled Experiments, Probability, Sampling Distributions and the Central Limit Theorem, Regression, Common Tests of Significance, Resampling, Multiple Comparisons.
Basic Descriptives using R Cmdr
In this 1-hour long project-based course, we will show you how to do basic descriptives using RCmdr .You will learn about measures of central tendency and dispersion. This project uses data about cereals that you eat and details about their sugar, fiber calorie content.
Note: This course works best for learners who are based in the North America region. We’re currently working on providing the same experience in other regions.
Python Packages for Data Science
How many times have you decided to learn a programming language but got stuck somewhere along the way, grew frustrated, and gave up? This specialization is designed for learners who have little or no programming experience but want to use Python as a tool to play with data.
Now that you have mastered the fundamentals of Python and Python functions, you will turn your attention to Python packages specifically used for Data Science, such as Pandas, Numpy, Matplotlib, and Seaborn.
Are you ready? Let's go!
Logo image courtesy of Mourizal Zativa. Available on Unsplash here: https://unsplash.com/photos/gNMVpAPe3PE
Foundations for Big Data Analysis with SQL
In this course, you'll get a big-picture view of using SQL for big data, starting with an overview of data, database systems, and the common querying language (SQL). Then you'll learn the characteristics of big data and SQL tools for working on big data platforms. You'll also install an exercise environment (virtual machine) to be used through the specialization courses, and you'll have an opportunity to do some initial exploration of databases and tables in that environment.
By the end of the course, you will be able to
• distinguish operational from analytic databases, and understand how these are applied in big data;
• understand how database and table design provides structures for working with data;
• appreciate how differences in volume and variety of data affects your choice of an appropriate database system;
• recognize the features and benefits of SQL dialects designed to work with big data systems for storage and analysis; and
• explore databases and tables in a big data platform.
To use the hands-on environment for this course, you need to download and install a virtual machine and the software on which to run it. Before continuing, be sure that you have access to a computer that meets the following hardware and software requirements:
• Windows, macOS, or Linux operating system (iPads and Android tablets will not work)
• 64-bit operating system (32-bit operating systems will not work)
• 8 GB RAM or more
• 25GB free disk space or more
• Intel VT-x or AMD-V virtualization support enabled (on Mac computers with Intel processors, this is always enabled;
on Windows and Linux computers, you might need to enable it in the BIOS)
• For Windows XP computers only: You must have an unzip utility such as 7-Zip or WinZip installed (Windows XP’s built-in unzip utility will not work)
Prepare Data for Exploration
This is the third course in the Google Data Analytics Certificate. These courses will equip you with the skills needed to apply to introductory-level data analyst jobs. As you continue to build on your understanding of the topics from the first two courses, you’ll also be introduced to new topics that will help you gain practical data analytics skills. You’ll learn how to use tools like spreadsheets and SQL to extract and make use of the right data for your objectives and how to organize and protect your data. Current Google data analysts will continue to instruct and provide you with hands-on ways to accomplish common data analyst tasks with the best tools and resources.
Learners who complete this certificate program will be equipped to apply for introductory-level jobs as data analysts. No previous experience is necessary.
By the end of this course, you will:
- Find out how analysts decide which data to collect for analysis.
- Learn about structured and unstructured data, data types, and data formats.
- Discover how to identify different types of bias in data to help ensure data credibility.
- Explore how analysts use spreadsheets and SQL with databases and data sets.
- Examine open data and the relationship between and importance of data ethics and data privacy.
- Gain an understanding of how to access databases and extract, filter, and sort the data they contain.
- Learn the best practices for organizing data and keeping it secure.
Popular Internships and Jobs by Categories
Find Jobs & Internships
Browse


© 2024 BoostGrad | All rights reserved