Back to Courses


Data Science Courses - Page 51
Showing results 501-510 of 1407
Graph Analytics for Big Data
Want to understand your data network structure and how it changes under different conditions? Curious to know how to identify closely interacting clusters within a graph? Have you heard of the fast-growing area of graph analytics and want to learn more? This course gives you a broad overview of the field of graph analytics so you can learn new ways to model, store, retrieve and analyze graph-structured data.
After completing this course, you will be able to model a problem into a graph database and perform analytical tasks over the graph in a scalable manner. Better yet, you will be able to apply these techniques to understand the significance of your data sets for your own projects.
GIS Data Acquisition and Map Design
In this course, you will learn how to find GIS data for your own projects, and how to create a well-designed map that effectively communicates your message. The first section focuses on the basic building blocks of GIS data, so that you know what types of GIS files exist, and the implications of choosing one type over another. Next, we'll discuss metadata (which is information about a data set) so you know how to evaluate a data set before you decide to use it, as well as preparing data by merging and clipping files as needed. We'll then talk about how to take non-GIS data, such as a list of addresses, and convert it into "mappable" data using geocoding. Finally, you'll learn about how to take data that you have found and design a map using cartographic principles. In the course project, you will find your own data and create your own quantitative map.
Note: software is not provided for this course.
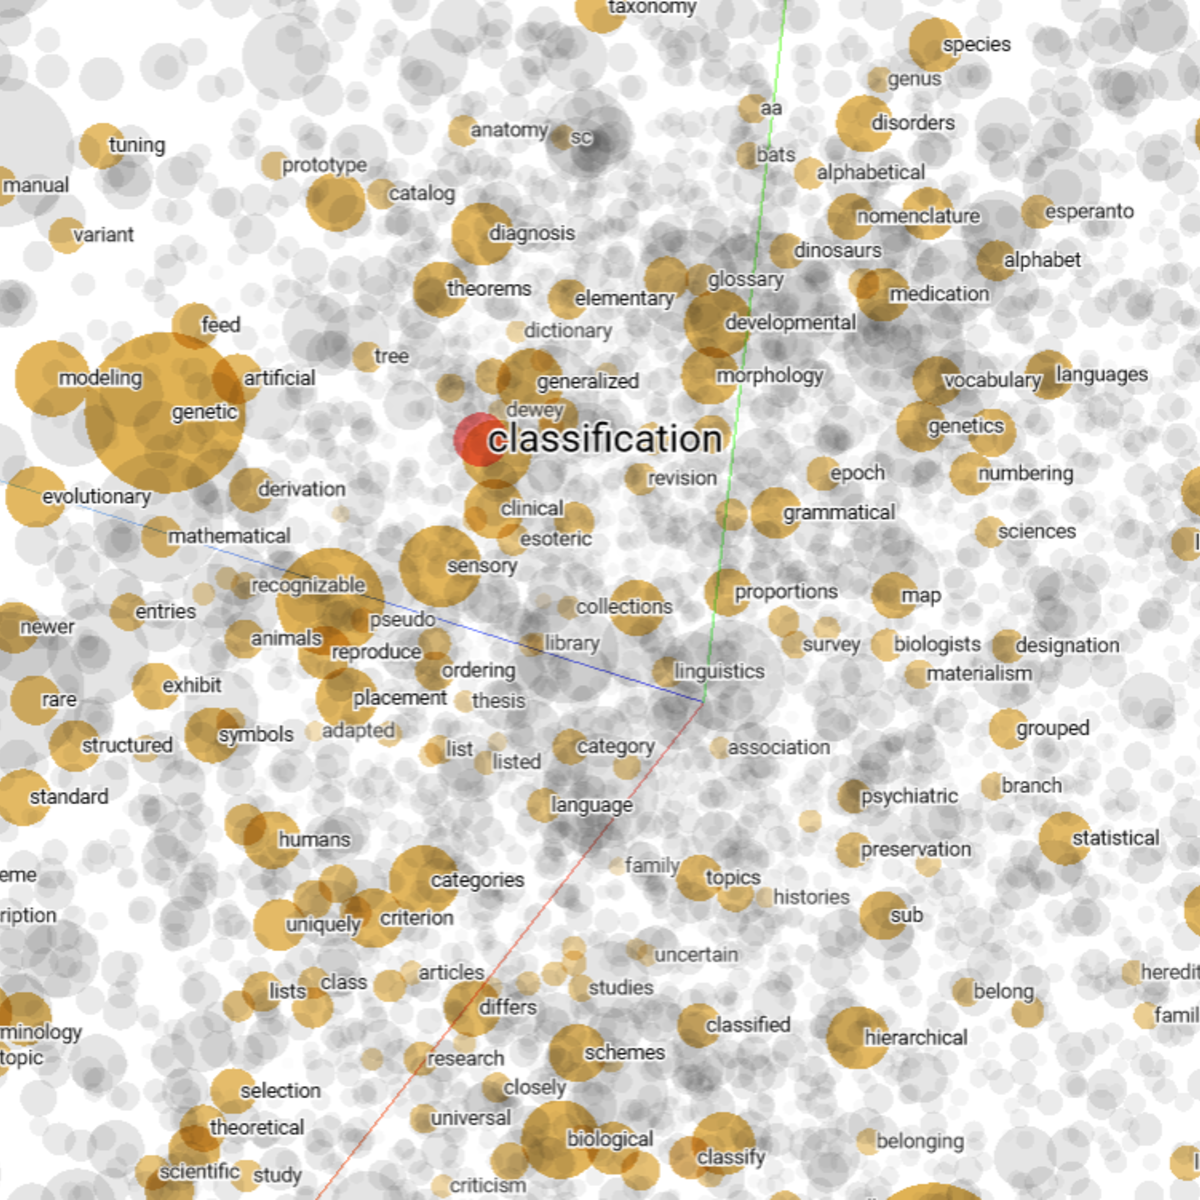
Convolutions for Text Classification with Keras
Welcome to this hands-on, guided introduction to Text Classification using 1D Convolutions with Keras. By the end of this project, you will be able to apply word embeddings for text classification, use 1D convolutions as feature extractors in natural language processing (NLP), and perform binary text classification using deep learning.
As a case study, we will work on classifying a large number of Wikipedia comments as being either toxic or not (i.e. comments that are rude, disrespectful, or otherwise likely to make someone leave a discussion). This issue is especially important, given the conversations the global community and tech companies are having on content moderation, online harassment, and inclusivity. The data set we will use comes from the Toxic Comment Classification Challenge on Kaggle.
To complete this guided project, we recommend that you have prior experience in Python programming, deep learning theory, and have used either Tensorflow or Keras to build deep learning models. We assume you have this foundational knowledge and want to learn how to use convolutions in NLP tasks such as classification.
Note: This course works best for learners based in the North America region. We’re currently working on providing the same experience in other regions.
Clinical Data Models and Data Quality Assessments
This course aims to teach the concepts of clinical data models and common data models. Upon completion of this course, learners will be able to interpret and evaluate data model designs using Entity-Relationship Diagrams (ERDs), differentiate between data models and articulate how each are used to support clinical care and data science, and create SQL statements in Google BigQuery to query the MIMIC3 clinical data model and the OMOP common data model.
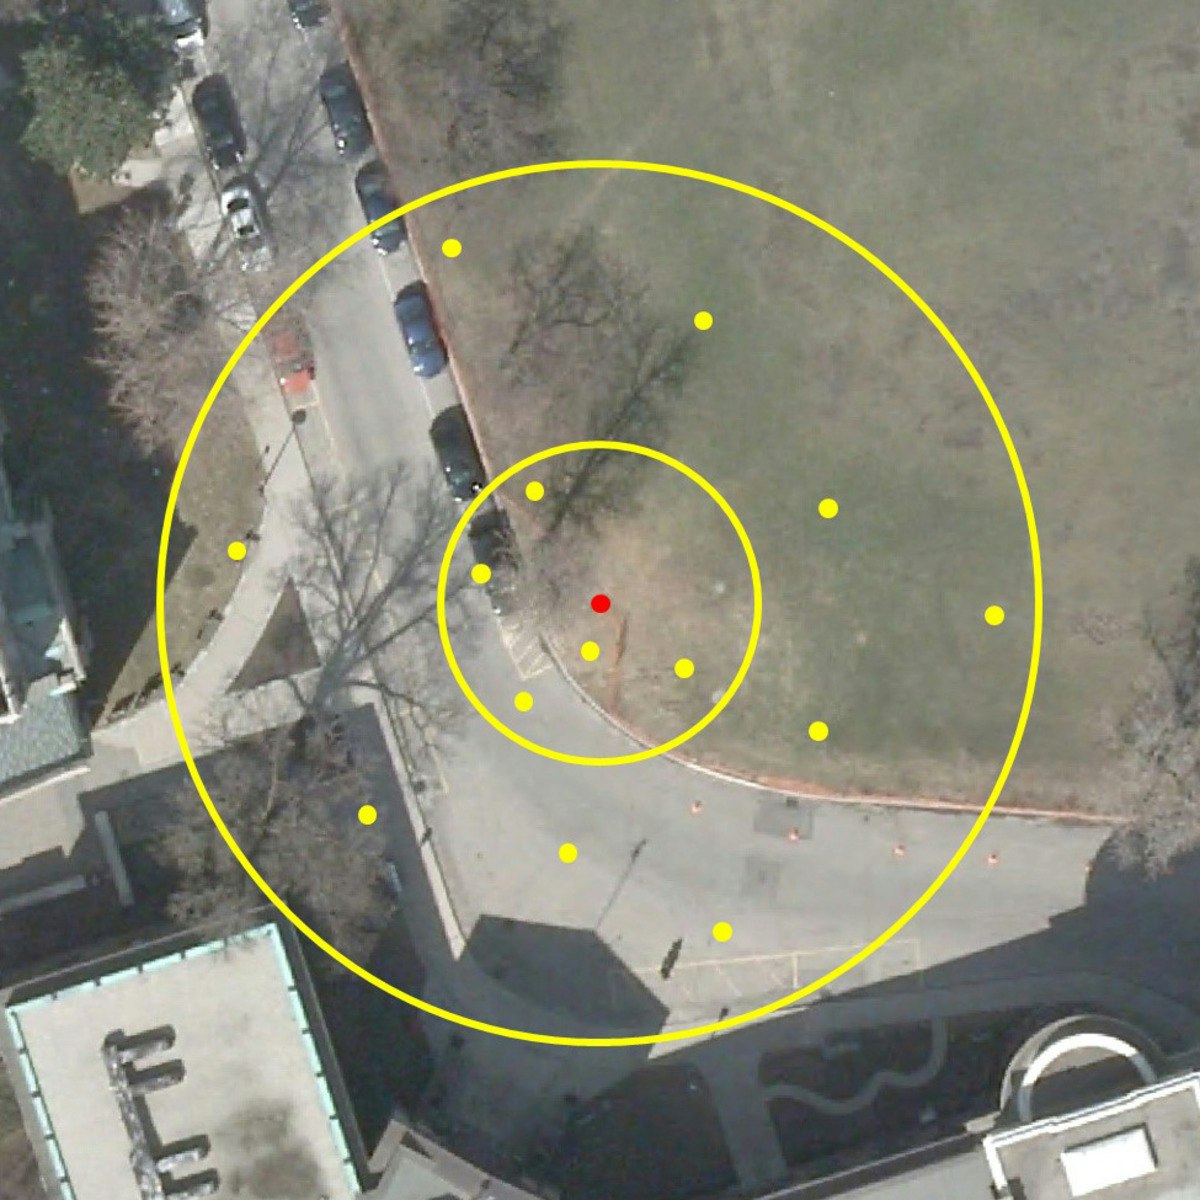
Tracking Objects in Video with Particle Filters
In this one hour long project-based course, you will tackle a real-world computer vision problem. We will be locating and tracking a target in a video shot with a digital camera. We will encounter some of the classic challenges that make computer vision difficult: noisy sensor data, objects that change shape, and occlusion (object hidden from view).
We will tackle these challenges with an artificial intelligence technique called a particle filter.
By the end of this project, you will have coded a particle filter from scratch using Python and numpy.
Note: This course works best for learners who are based in the North America region. We’re currently working on providing the same experience in other regions.
Generate an Invoice with LibreOffice Base
By the end of this project, you will have used a LibreOffice Base query to retrieve data from a database and used the query results to build an invoice with the LibreOffice Base reporting feature. An invoice is a typical document used by many organizations to bill customers for products or services. Creating the invoice is a two-step process: retrieve the data and display it as an invoice. While retrieving the correct data is an essential skill for a database application developer, arranging and presenting the data in a format that a user finds useful is just as important.
Note: This course works best for learners who are based in the North America region. We’re currently working on providing the same experience in other regions.
Interactive Geospatial Visualization:Kepler GL & Jupyter Lab
In this 1-hour long project-based course, you will learn how to easily create beautiful data visualization with Kepler inside Jupyter Notebooks and effectively design different geospatial data visualizations.
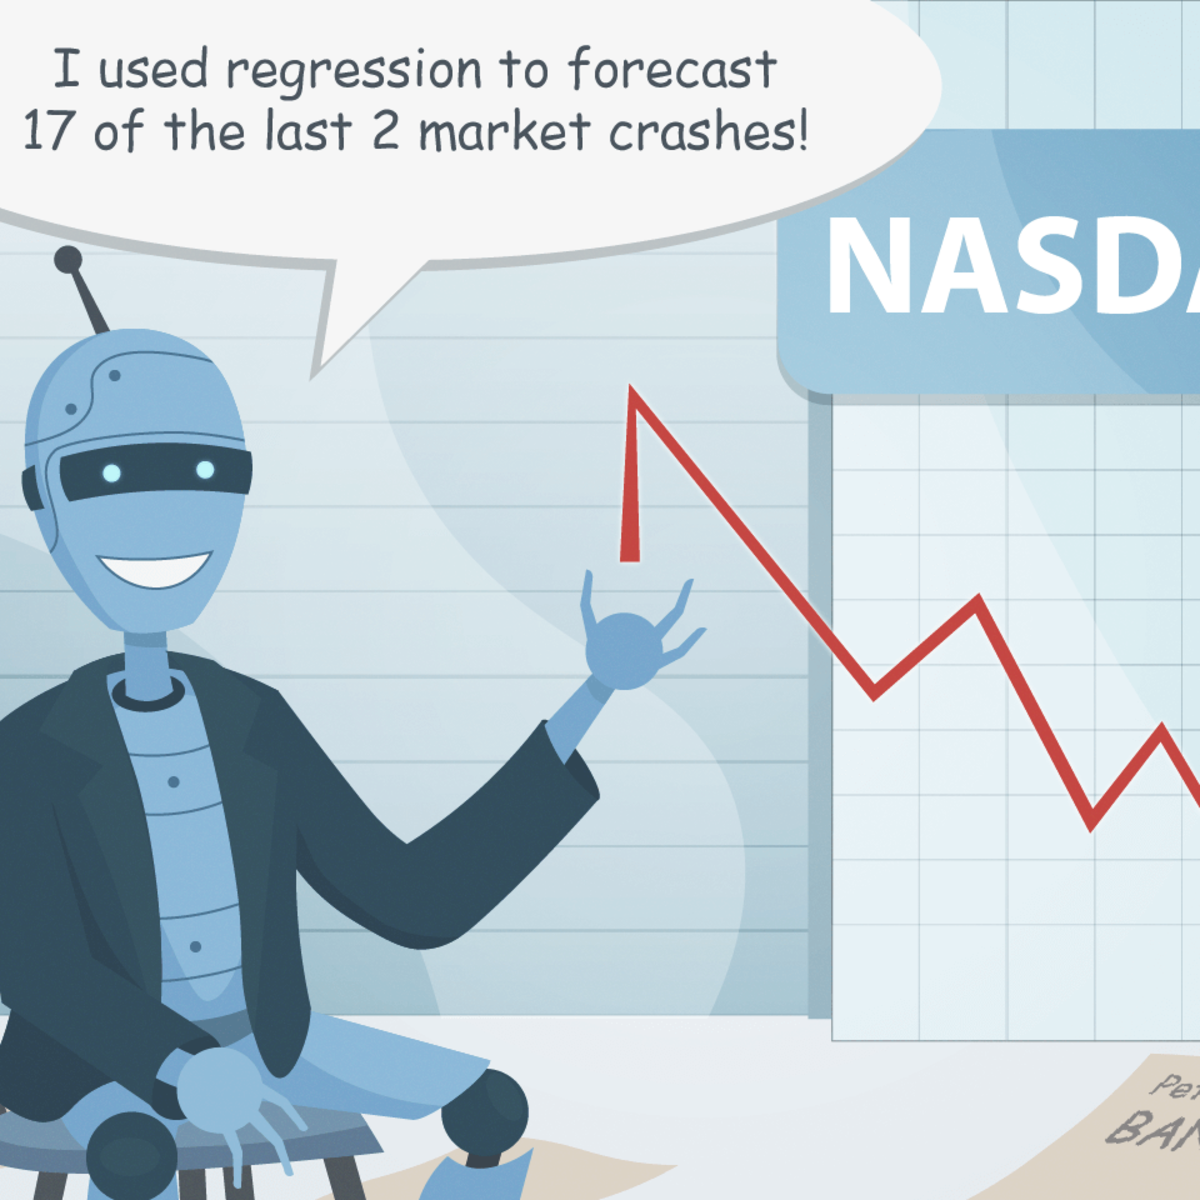
Regression with Automatic Differentiation in TensorFlow
In this 1.5 hour long project-based course, you will learn about constants and variables in TensorFlow, you will learn how to use automatic differentiation, and you will apply automatic differentiation to solve a linear regression problem. By the end of this project, you will have a good understanding of how machine learning algorithms can be implemented in TensorFlow.
In order to be successful in this project, you should be familiar with Python, Gradient Descent, Linear Regression.
Note: This course works best for learners who are based in the North America region. We’re currently working on providing the same experience in other regions.
Deep Learning with PyTorch : Neural Style Transfer
In this 2 hour-long project-based course, you will learn to implement neural style transfer using PyTorch. Neural Style Transfer is an optimization technique used to take a content and a style image and blend them together so the output image looks like the content image but painted in the style of the style image. We will create artistic style image using content and given style image. We will compute the content and style loss function. We will minimize this loss function using optimization techniques to get an artistic style image that retains content features and style features.
This guided project is for learners who want to apply neural style transfer practically using PyTorch.
In order to be successful in this guided project, you should be familiar with the theoretical concept of neural style transfer, python programming, and convolutional neural networks.A google account is needed to use the Google colab environment.
Data Processing and Feature Engineering with MATLAB
In this course, you will build on the skills learned in Exploratory Data Analysis with MATLAB to lay the foundation required for predictive modeling. This intermediate-level course is useful to anyone who needs to combine data from multiple sources or times and has an interest in modeling.
These skills are valuable for those who have domain knowledge and some exposure to computational tools, but no programming background. To be successful in this course, you should have some background in basic statistics (histograms, averages, standard deviation, curve fitting, interpolation) and have completed Exploratory Data Analysis with MATLAB.
Throughout the course, you will merge data from different data sets and handle common scenarios, such as missing data. In the last module of the course, you will explore special techniques for handling textual, audio, and image data, which are common in data science and more advanced modeling. By the end of this course, you will learn how to visualize your data, clean it up and arrange it for analysis, and identify the qualities necessary to answer your questions. You will be able to visualize the distribution of your data and use visual inspection to address artifacts that affect accurate modeling.
Popular Internships and Jobs by Categories
Find Jobs & Internships
Browse


© 2024 BoostGrad | All rights reserved