Back to Courses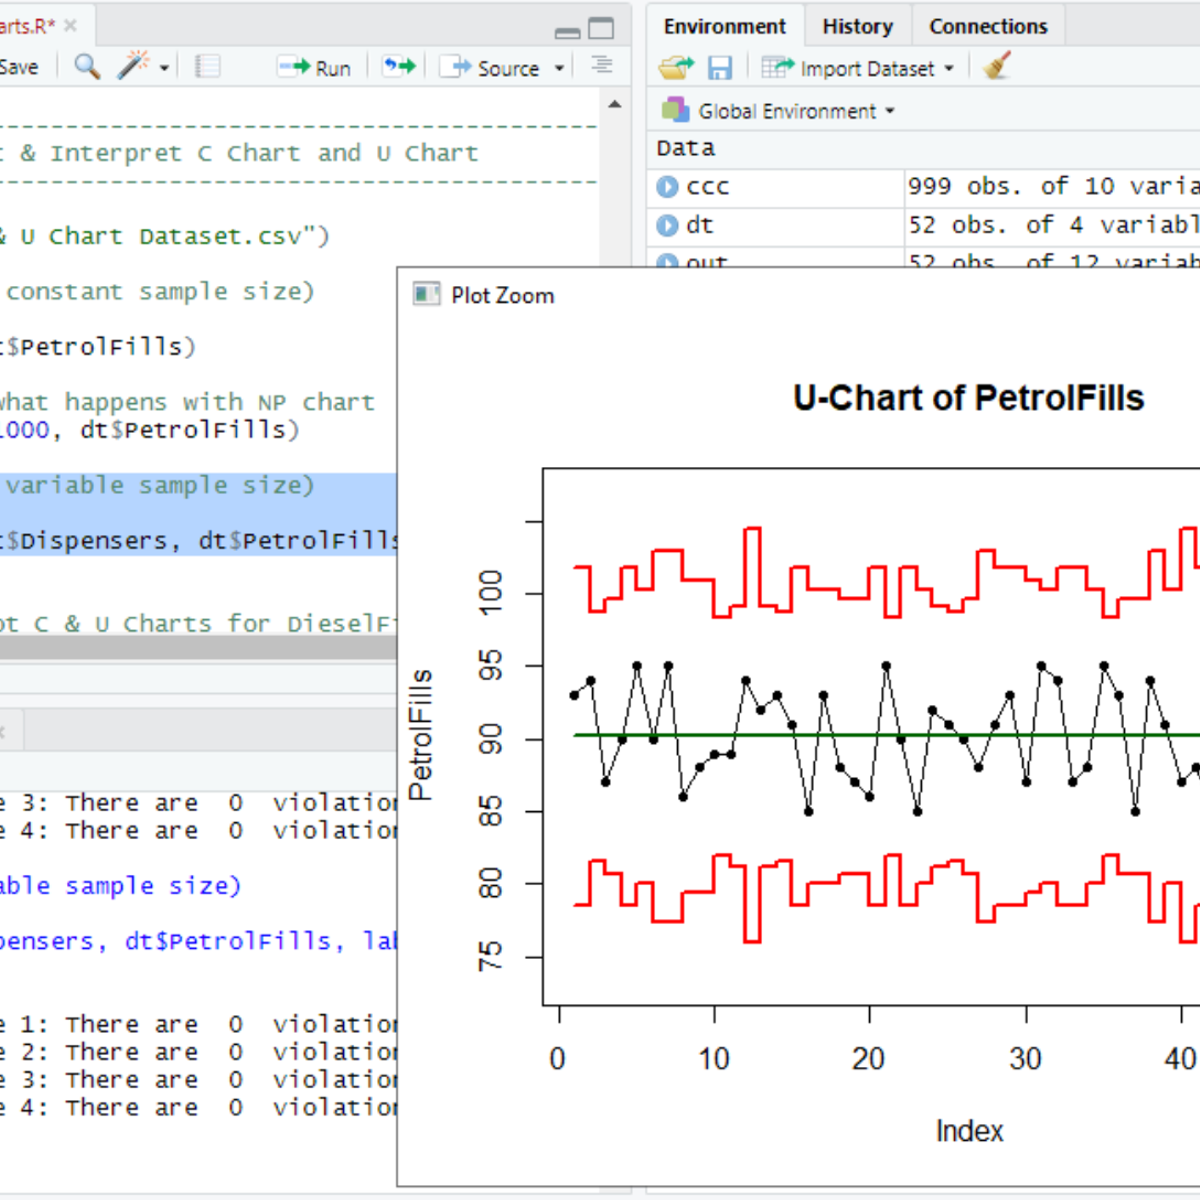


Data Science Courses - Page 48
Showing results 471-480 of 1407
RStudio for Six Sigma - Control Charts
Welcome to RStudio for Six Sigma - Control Charts. This is a project-based course which should take under 2 hours to finish. Before diving into the project, please take a look at the course objectives and structure.
By the end of this project, you will learn to identify data types (Variables, Attribute Type I & II), understand the overview of Statistical Process Control, pick the right Control Chart based on the data type and other criteria, plot and interpret control charts. This Guided Project covers IMR Charts (XMR), Xbar-R Charts, Xbar-S Charts, NP Chart, P Chart, C Chart and U Chart. You will also learn about Western Electric Rules and Nelson's rules used to interpret the stability of the process.
COVID19 Data Analysis Using Python
In this project, you will learn how to preprocess and merge datasets to calculate needed measures and prepare them for an Analysis. In this project, we are going to work with the COVID19 dataset, published by John Hopkins University, which consists of the data related to the cumulative number of confirmed cases, per day, in each Country. Also, we have another dataset consist of various life factors, scored by the people living in each country around the globe. We are going to merge these two datasets to see if there is any relationship between the spread of the virus in a country and how happy people are, living in that country.
Notes: This project works best for learners who are based in the North America region. We’re currently working on providing the same experience in other regions.
Unsupervised Algorithms in Machine Learning
One of the most useful areas in machine learning is discovering hidden patterns from unlabeled data. Add the fundamentals of this in-demand skill to your Data Science toolkit. In this course, we will learn selected unsupervised learning methods for dimensionality reduction, clustering, and learning latent features. We will also focus on real-world applications such as recommender systems with hands-on examples of product recommendation algorithms.
Prior coding or scripting knowledge is required. We will be utilizing Python extensively throughout the course. College-level math skills, including Calculus and Linear Algebra, are needed. It is recommended, but not required, to take the first course in the specialization, Introduction to Machine Learning: Supervised Learning.
This course can be taken for academic credit as part of CU Boulder’s Master of Science in Data Science (MS-DS) degree offered on the Coursera platform. The MS-DS is an interdisciplinary degree that brings together faculty from CU Boulder’s departments of Applied Mathematics, Computer Science, Information Science, and others. With performance-based admissions and no application process, the MS-DS is ideal for individuals with a broad range of undergraduate education and/or professional experience in computer science, information science, mathematics, and statistics. Learn more about the MS-DS program at https://www.coursera.org/degrees/master-of-science-data-science-boulder.
Course logo image by Ryan Wallace on Unsplash.
Get Started with R Markdown
Welcome to this project-based course, Get Started with R Markdown. This project-based course is for people who are learning R and seek useful ways to organize their work in R. We will start this hands-on project with an overview of the project; then, we will get familiar with the RStudio interface and install the rmarkdown package. Be rest assured that you will learn a ton of good work here.
In this project, you will learn about R Markdowns and its’ usefulness to you as an R user. By the end of this 2-hour long project, you will be able to create an R Markdown, understand the different components of the file, knit the file as an HTML document or a pdf document and write some R Markdown commands. By extension, we will learn how to publish the knitted document on RPubs.
This project aims at learners looking to get started using the R programming language to create reproducible documents. There are no hard prerequisites, and any competent computer user should complete the project successfully.
Algorithms for DNA Sequencing
We will learn computational methods -- algorithms and data structures -- for analyzing DNA sequencing data. We will learn a little about DNA, genomics, and how DNA sequencing is used. We will use Python to implement key algorithms and data structures and to analyze real genomes and DNA sequencing datasets.
Data-Driven Process Improvement
By the end of this course, learners are empowered to implement data-driven process improvement objectives at their organization. The course covers: the business case for IoT (Internet of Things), the strategic importance of aligning operations and performance goals, best practices for collecting data, and facilitating a process mapping activity to visualize and analyze a process’s flow of materials and information. Learners are prepared to focus efforts around business needs, evaluate what the organization should measure, discern between different types of IoT data and collect key performance indicators (KPIs) using IoT technology. Learners have the opportunity to implement process improvement objectives in a mock scenario and consider how the knowledge can be transferred to their own organizational contexts.
Material includes online lectures, videos, demos, project work, readings and discussions. This course is ideal for individuals keen on developing a data-driven mindset that derives powerful insights useful for improving a company’s bottom line. It is helpful if learners have some familiarity with reading reports, gathering and using data, and interpreting visualizations. It is the first course in the Data-Driven Decision Making (DDDM) specialization. To learn more about the specialization, check out a video overview at https://www.youtube.com/watch?v=Oi4mmeSWcVc&list=PLQvThJe-IglyYljMrdqwfsDzk56ncfoLx&index=11.
Improving Your Statistical Questions
This course aims to help you to ask better statistical questions when performing empirical research. We will discuss how to design informative studies, both when your predictions are correct, as when your predictions are wrong. We will question norms, and reflect on how we can improve research practices to ask more interesting questions. In practical hands on assignments you will learn techniques and tools that can be immediately implemented in your own research, such as thinking about the smallest effect size you are interested in, justifying your sample size, evaluate findings in the literature while keeping publication bias into account, performing a meta-analysis, and making your analyses computationally reproducible.
If you have the time, it is recommended that you complete my course 'Improving Your Statistical Inferences' before enrolling in this course, although this course is completely self-contained.
Clinical Natural Language Processing
This course teaches you the fundamentals of clinical natural language processing (NLP). In this course you will learn the basic linguistic principals underlying NLP, as well as how to write regular expressions and handle text data in R. You will also learn practical techniques for text processing to be able to extract information from clinical notes. Finally, you will have a chance to put your skills to the test with a real-world practical application where you develop text processing algorithms to identify diabetic complications from clinical notes. You will complete this work using a free, online computational environment for data science hosted by our Industry Partner Google Cloud.
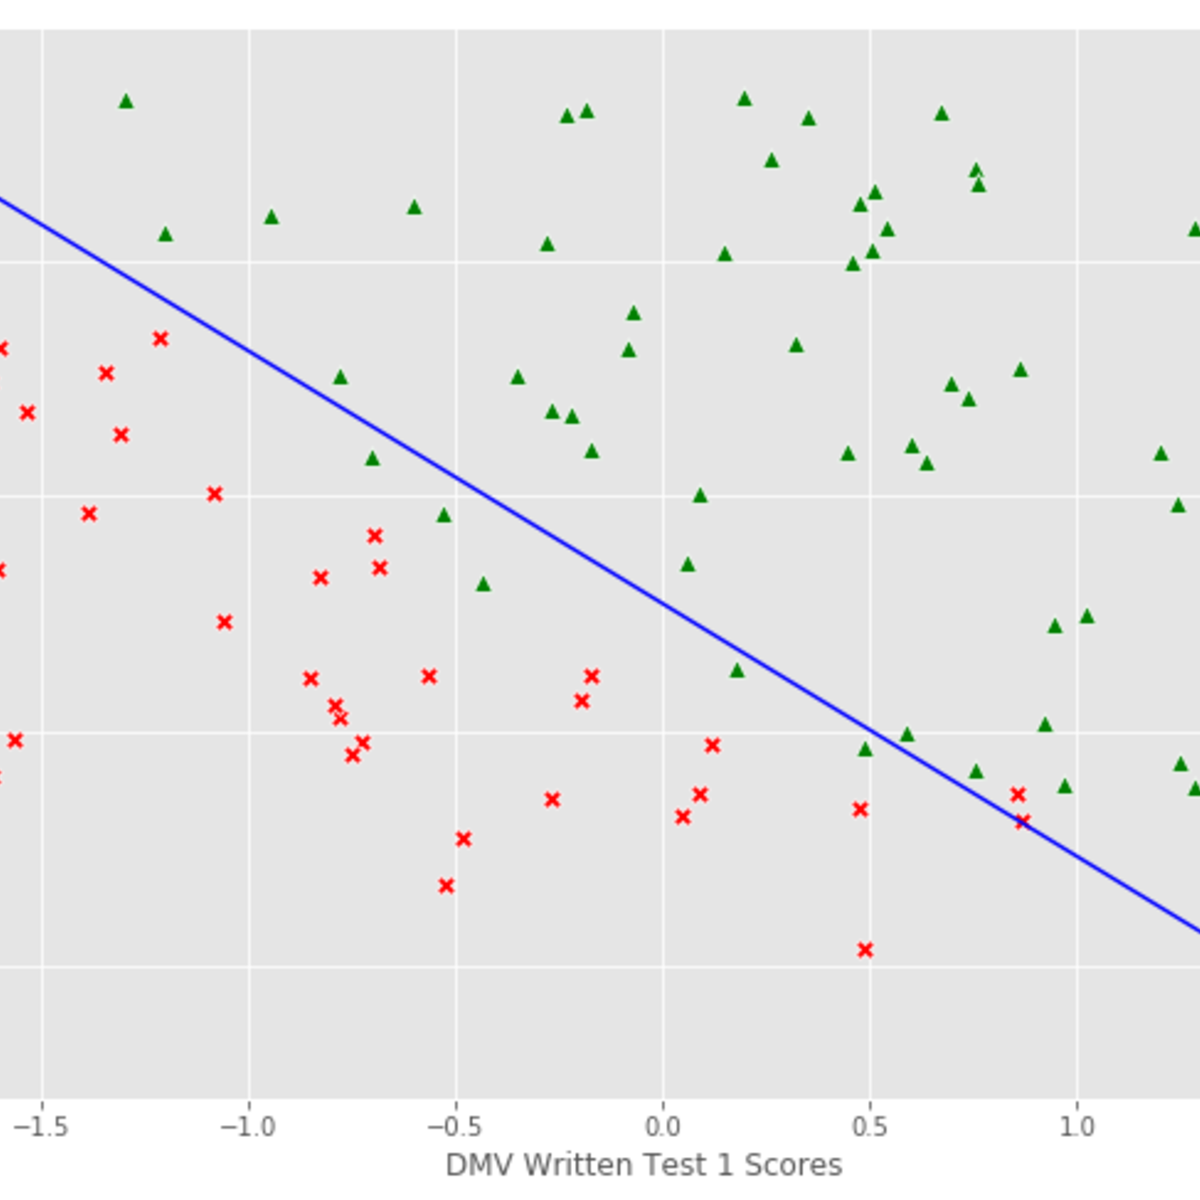
Logistic Regression with NumPy and Python
Welcome to this project-based course on Logistic with NumPy and Python. In this project, you will do all the machine learning without using any of the popular machine learning libraries such as scikit-learn and statsmodels. The aim of this project and is to implement all the machinery, including gradient descent, cost function, and logistic regression, of the various learning algorithms yourself, so you have a deeper understanding of the fundamentals. By the time you complete this project, you will be able to build a logistic regression model using Python and NumPy, conduct basic exploratory data analysis, and implement gradient descent from scratch. The prerequisites for this project are prior programming experience in Python and a basic understanding of machine learning theory.
This course runs on Coursera's hands-on project platform called Rhyme. On Rhyme, you do projects in a hands-on manner in your browser. You will get instant access to pre-configured cloud desktops containing all of the software and data you need for the project. Everything is already set up directly in your internet browser so you can just focus on learning. For this project, you’ll get instant access to a cloud desktop with Python, Jupyter, NumPy, and Seaborn pre-installed.
Computational Thinking with JavaScript 2: Model & Analyse
This is the second course in a sequence of four courses that develops essential 21st century computational thinking (CT) skills using the popular JavaScript programming language.
At the end of this second course you will: know a framework for CT to help you model the real world using abstract data structures; have developing CT skills so that you can perform comon data analytics tasks; be able to read and write programs in JavaScript that involve processing, analysing and visualizing data, using a specialised library; and post your creations on the web to share your code with others.
This course is suitable for: learners who have taken the first course in this specialization 'Computational Thinking in JavaScript 1: Draw and Animate' or for those who have basic JavaScript skills and want to learn about simple data analytics.
Popular Internships and Jobs by Categories
Find Jobs & Internships
Browse


© 2024 BoostGrad | All rights reserved