Back to Courses


Data Science Courses - Page 34
Showing results 331-340 of 1407
Google Cloud Big Data and Machine Learning Fundamentals
This course introduces the Google Cloud big data and machine learning products and services that support the data-to-AI lifecycle. It explores the processes, challenges, and benefits of building a big data pipeline and machine learning models with Vertex AI on Google Cloud.
Python and Machine-Learning for Asset Management with Alternative Data Sets
Over-utilization of market and accounting data over the last few decades has led to portfolio crowding, mediocre performance and systemic risks, incentivizing financial institutions which are looking for an edge to quickly adopt alternative data as a substitute to traditional data. This course introduces the core concepts around alternative data, the most recent research in this area, as well as practical portfolio examples and actual applications. The approach of this course is somewhat unique because while the theory covered is still a main component, practical lab sessions and examples of working with alternative datasets are also key. This course is fo you if you are aiming at carreers prospects as a data scientist in financial markets, are looking to enhance your analytics skillsets to the financial markets, or if you are interested in cutting-edge technology and research as they apply to big data. The required background is: Python programming, Investment theory , and Statistics. This course will enable you to learn new data and research techniques applied to the financial markets while strengthening data science and python skills.
Diabetes Prediction With Pyspark MLLIB
In this 1 hour long project-based course, you will learn to build a logistic regression model using Pyspark MLLIB to classify patients as either diabetic or non-diabetic. We will use the popular Pima Indian Diabetes data set. Our goal is to use a simple logistic regression classifier from the pyspark Machine learning library for diabetes classification. We will be carrying out the entire project on the Google Colab environment with the installation of Pyspark.You will need a free Gmail account to complete this project. Please be aware of the fact that the dataset and the model in this project, can not be used in the real-life. We are only using this data for the educational purpose.
By the end of this project, you will be able to build the logistic regression classifier using Pyspark MLlib to classify between the diabetic and nondiabetic patients.You will also be able to setup and work with Pyspark on Google colab environment. Additionally, you will also be able to clean and prepare data for analysis.
You should be familiar with the Python Programming language and you should have a theoretical understanding of the Logistic Regression algorithm. You will need a free Gmail account to complete this project.
Note: This course works best for learners who are based in the North America region. We’re currently working on providing the same experience in other regions.
Communicating Business Analytics Results
The analytical process does not end with models than can predict with accuracy or prescribe the best solution to business problems. Developing these models and gaining insights from data do not necessarily lead to successful implementations. This depends on the ability to communicate results to those who make decisions. Presenting findings to decision makers who are not familiar with the language of analytics presents a challenge. In this course you will learn how to communicate analytics results to stakeholders who do not understand the details of analytics but want evidence of analysis and data. You will be able to choose the right vehicles to present quantitative information, including those based on principles of data visualization. You will also learn how to develop and deliver data-analytics stories that provide context, insight, and interpretation.
Introduction to Business Analytics and Information Economics Capstone
Welcome to the Introduction to Business Analytics and Information Economics Capstone! I’m thrilled to have you enrolled in the course. This Capstone will enable you to put into practice some of the concepts you have studied previously about applying economic concepts to information, conceiving analytics hypotheses, valuing information assets, and developing ideas for monetizing information in various ways. I look forward to your contributions and ideas.
Managing, Describing, and Analyzing Data
In this course, you will learn the basics of understanding the data you have and why correctly classifying data is the first step to making correct decisions. You will describe data both graphically and numerically using descriptive statistics and R software. You will learn four probability distributions commonly used in the analysis of data. You will analyze data sets using the appropriate probability distribution. Finally, you will learn the basics of sampling error, sampling distributions, and errors in decision-making.
This course can be taken for academic credit as part of CU Boulder’s Master of Science in Data Science (MS-DS) degree offered on the Coursera platform. The MS-DS is an interdisciplinary degree that brings together faculty from CU Boulder’s departments of Applied Mathematics, Computer Science, Information Science, and others. With performance-based admissions and no application process, the MS-DS is ideal for individuals with a broad range of undergraduate education and/or professional experience in computer science, information science, mathematics, and statistics. Learn more about the MS-DS program at https://www.coursera.org/degrees/master-of-science-data-science-boulder.
Turn Ethical Frameworks into Actionable Steps
Ethical principles build a strong foundation for driving ethical technologies. Principles alone can be elusive and impractical for application. Ethical frameworks based upon these principles provide a structure to guide technologists when implementing data-driven solutions. However, ethical frameworks, along with standards and regulations, can make compliance tasks more complex, and they can also raise the tension between ethical duties and business practicalities. An approach is needed to reconcile these issues. This second course within the Certified Ethical Emerging Technologist (CEET) professional certificate is designed for learners seeking to analyze ethical frameworks, regulations, standards, and best practices and integrate them into data-driven solutions.
Students will become familiar with frameworks and the common ethical principles they are based upon and how they can be applied across a variety of ethically driven dilemmas. You will learn applicable regulations and best practices established across global organizations and governments and how to navigate the integration of these standards in the context of business needs.
This course is the second of five courses within the Certified Ethical Emerging Technologist (CEET) professional certificate. The preceding course is titled Promote the Ethical Use of Data-Driven Technologies.
Design Thinking and Predictive Analytics for Data Products
This is the second course in the four-course specialization Python Data Products for Predictive Analytics, building on the data processing covered in Course 1 and introducing the basics of designing predictive models in Python. In this course, you will understand the fundamental concepts of statistical learning and learn various methods of building predictive models. At each step in the specialization, you will gain hands-on experience in data manipulation and building your skills, eventually culminating in a capstone project encompassing all the concepts taught in the specialization.
Machine Learning: Classification
Case Studies: Analyzing Sentiment & Loan Default Prediction
In our case study on analyzing sentiment, you will create models that predict a class (positive/negative sentiment) from input features (text of the reviews, user profile information,...). In our second case study for this course, loan default prediction, you will tackle financial data, and predict when a loan is likely to be risky or safe for the bank. These tasks are an examples of classification, one of the most widely used areas of machine learning, with a broad array of applications, including ad targeting, spam detection, medical diagnosis and image classification.
In this course, you will create classifiers that provide state-of-the-art performance on a variety of tasks. You will become familiar with the most successful techniques, which are most widely used in practice, including logistic regression, decision trees and boosting. In addition, you will be able to design and implement the underlying algorithms that can learn these models at scale, using stochastic gradient ascent. You will implement these technique on real-world, large-scale machine learning tasks. You will also address significant tasks you will face in real-world applications of ML, including handling missing data and measuring precision and recall to evaluate a classifier. This course is hands-on, action-packed, and full of visualizations and illustrations of how these techniques will behave on real data. We've also included optional content in every module, covering advanced topics for those who want to go even deeper!
Learning Objectives: By the end of this course, you will be able to:
-Describe the input and output of a classification model.
-Tackle both binary and multiclass classification problems.
-Implement a logistic regression model for large-scale classification.
-Create a non-linear model using decision trees.
-Improve the performance of any model using boosting.
-Scale your methods with stochastic gradient ascent.
-Describe the underlying decision boundaries.
-Build a classification model to predict sentiment in a product review dataset.
-Analyze financial data to predict loan defaults.
-Use techniques for handling missing data.
-Evaluate your models using precision-recall metrics.
-Implement these techniques in Python (or in the language of your choice, though Python is highly recommended).
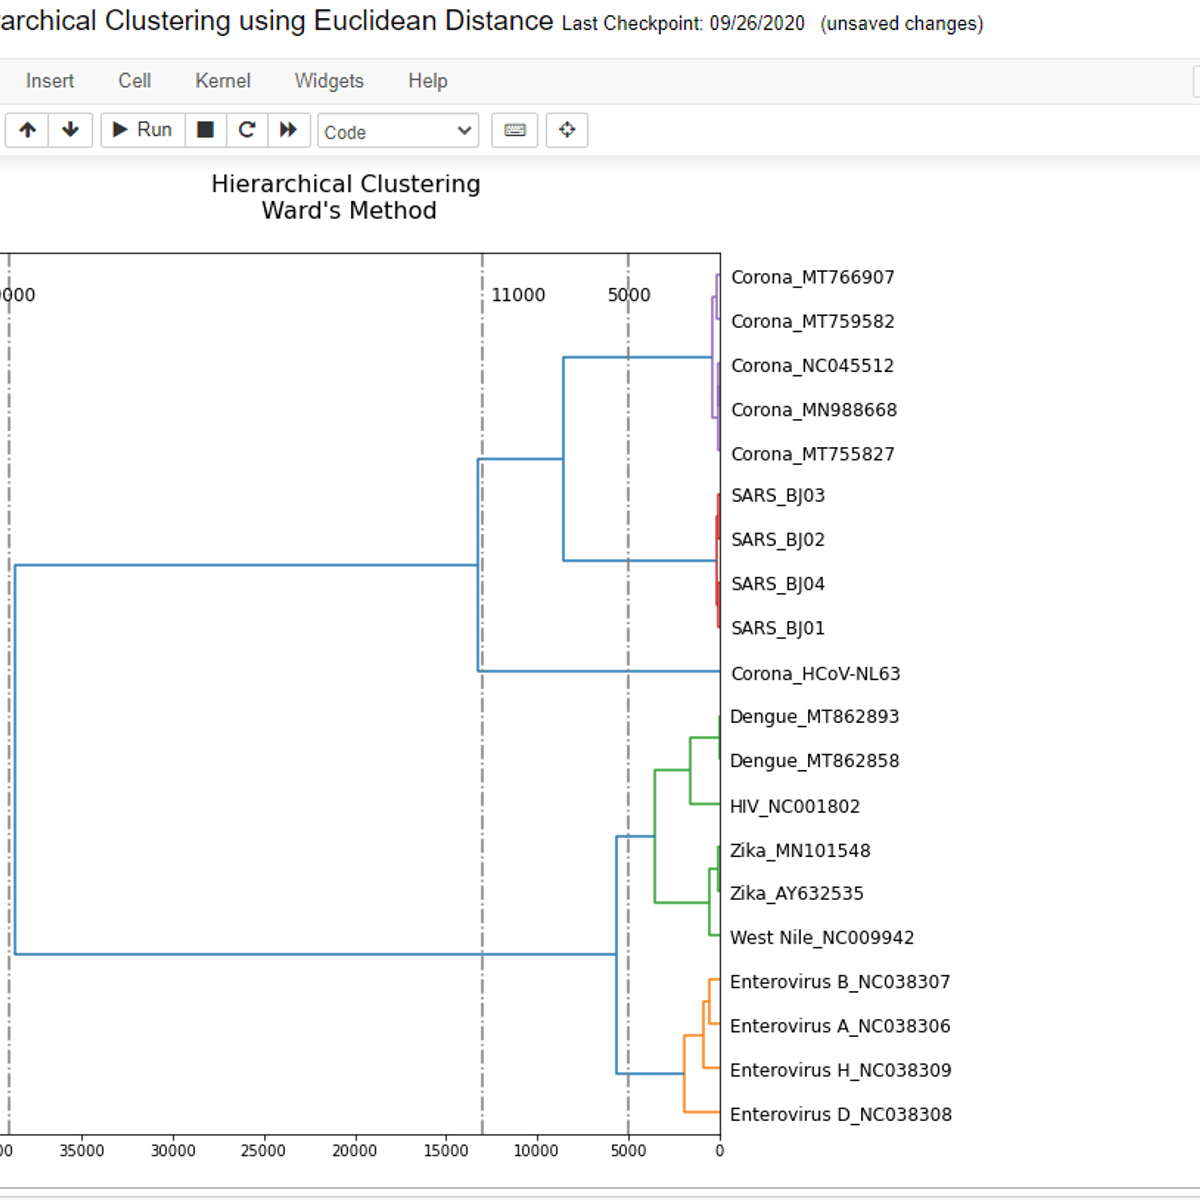
Hierarchical Clustering using Euclidean Distance
By the end of this project, you will create a Python program using a jupyter interface that analyzes a group of viruses and plot a dendrogram based on similarities among them. The dendrogram that you will create will depend on the cumulative skew profile, which in turn depends on the nucleotide composition. You will use complete genome sequences for many viruses including, Corona, SARS, HIV, Zika, Dengue, enterovirus, and West Nile viruses.
Popular Internships and Jobs by Categories
Find Jobs & Internships
Browse


© 2024 BoostGrad | All rights reserved