
Back to Courses


Data Science Courses - Page 136
Showing results 1351-1360 of 1407
Data Visualization using Microsoft Excel
Have you ever been asked to create a report based on a lot of data and you did not know where to begin? Or, you simply needed to demonstrate data from different sources all in one place with minimum effort? By the end of this project, you will learn how to operate data to generate a report and demonstrate information in a comprehensive visual way in Microsoft Excel.
In this project, you will create a free account on Microsoft 365, you will get access to Microsoft Excel and use data to generate a report with informative charts that you can present to your audience. Your new skills will help you efficiently make decisions based on a visual data presentation.
Excel Skills for Business: Intermediate II
Spreadsheet software remains one of the most ubiquitous pieces of software used in workplaces across the world. Learning to confidently operate this software means adding a highly valuable asset to your employability portfolio. In this third course of our Excel specialization Excel Skills for Business you will delve deeper into some of the most powerful features Excel has to offer. When you have successfully completed the course you will be able to
Check for and prevent errors in spreadsheets;
Create powerful automation in spreadsheets;
Apply advanced formulas and conditional logic to help make informed business decisions; and
Create spreadsheets that help forecast and model data.
Once again, we have brought together a great teaching team that will be with you every step of the way. Nicky, Prashan and myself will guide you through each week. As we are exploring these more advanced topics, we are following Alex who is an Excel consultant called in by businesses that experience issues with their spreadsheets.
Python Optical Character Recognition using Pytorch
Note: The rhyme platform currently does not support webcams, so this is not a live project.
This guided project is about optical character recognition using Pythorch, a Python library. This comes under the computer vision domain.
While you are watching me code, you will get a cloud desktop with all the required software pre-installed. This will allow you to code along with me. After all, we learn best with active, hands-on learning.
Note: This project works best for learners who are based in the North America region. We’re currently working on providing the same experience in other regions.
Data – What It Is, What We Can Do With It
This course introduces students to data and statistics. By the end of the course, students should be able to interpret descriptive statistics, causal analyses and visualizations to draw meaningful insights.
The course first introduces a framework for thinking about the various purposes of statistical analysis. We’ll talk about how analysts use data for descriptive, causal and predictive inference. We’ll then cover how to develop a research study for causal analysis, compute and interpret descriptive statistics and design effective visualizations. The course will help you to become a thoughtful and critical consumer of analytics.
If you are in a field that increasingly relies on data-driven decision making, but you feel unequipped to interpret and evaluate data, this course will help you develop these fundamental tools of data literacy.
Advanced Models for Decision Making
Business analysts need to be able to prescribe optimal solution to problems. But analytics courses are often focused on training students in data analysis and visualization, not so much in helping them figure out how to take the available data and pair that with the right mathematical model to formulate a solution. This course is designed to connect data and models to real world decision-making scenarios in manufacturing, supply chain, finance, human resource management, etc. In particular, we understand how linear optimization - a prescriptive analytics method - can be used to formulate decision problems and provide data-based optimal solutions. Throughout this course we will work on applied problems in different industries, such as:
(a) Finance Decisions: How should an investment manager create an optimal portfolio that maximizes net returns while not taking too much risks across various investments?
(b) Production Decisions: Given projected demand, supply of raw materials, and transportation costs, what would be the optimal volume of products to manufacture at different plant locations?
(c) HR Decisions: How many workers need to be hired or terminated over a planning horizon to minimize cost while meeting operational needs of a company?
(c) Manufacturing: What would be the profit maximizing product mix that should be produced, given the raw material availability and customer demand?
We will learn how to formulate these problems as mathematical models and solve them using Excel spreadsheet.
Classify Text into Categories with the Natural Language API
This is a self-paced lab that takes place in the Google Cloud console. In this lab you’ll learn how to classify text into categories using the Natural Language API.
Deploy a Video indexing Application using Amazon Rekognition
In this one-hour project, you will understand how Amazon Rekognition works for video analysis and what information is generated for video indexing. You will learn how to deploy a Web Application that uses the AWS SDK to upload and index videos to detect faces, objects, and labels in scenes, maturity content, identify celebrities, and more.
Amazon Rekognition is one of the most used Artificial Intelligence services in AWS and is favored to analyze images and videos with colossal confidence and low costs.
Once you're done with this project, you will be able to use Amazon Rekognition to analyze and index your videos in just a few steps.
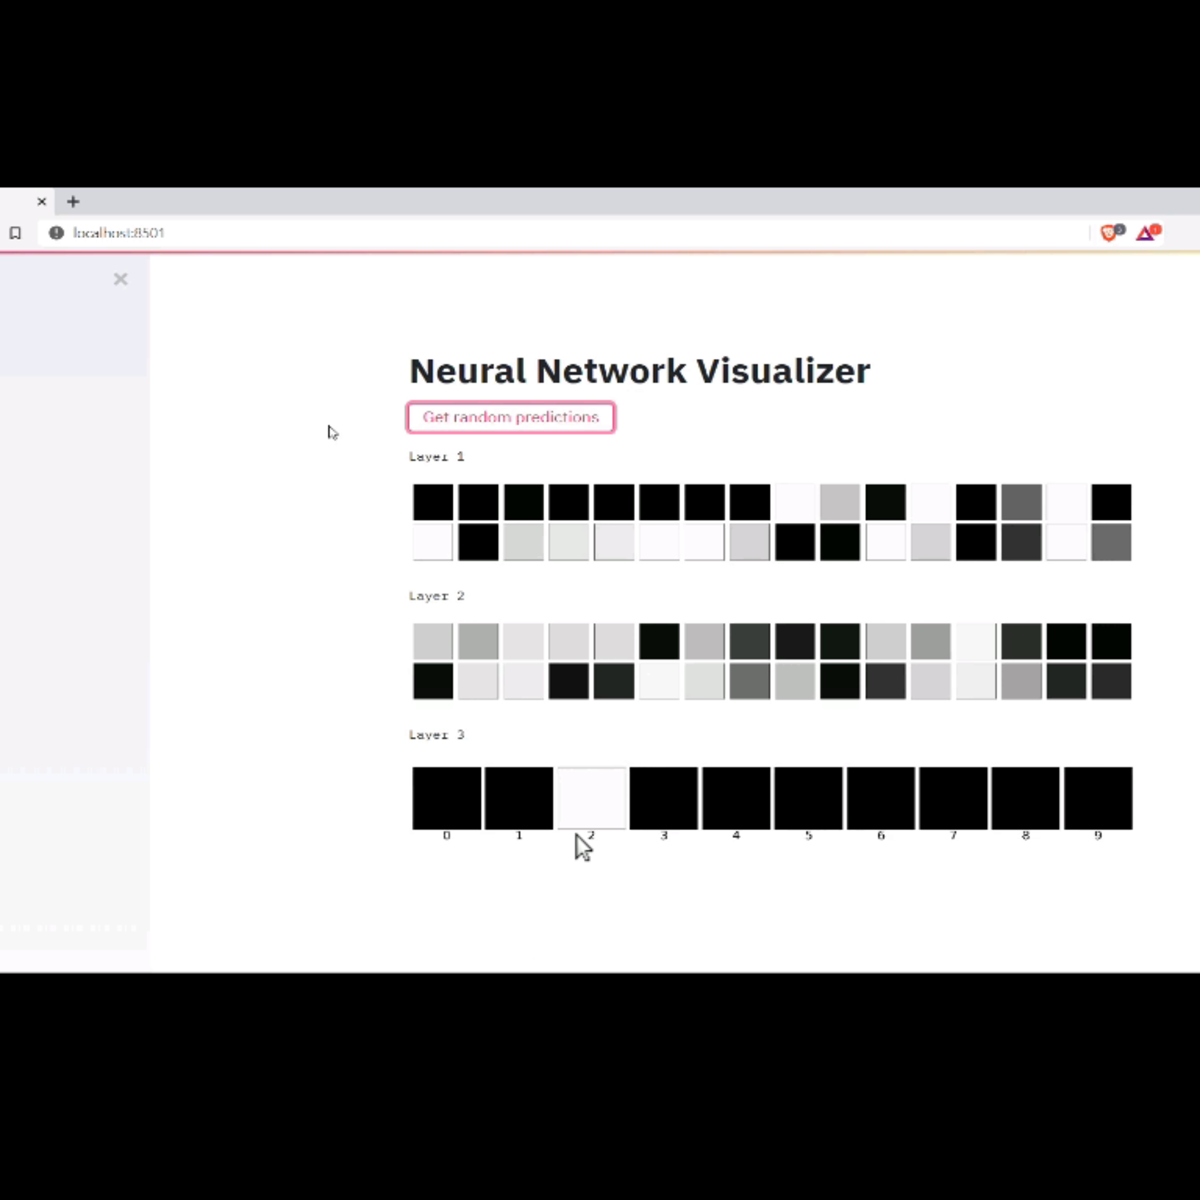
Neural Network Visualizer Web App with Python
In this 2 hour long project-based course, you will learn to create a Neural Network Visualizer web application using Streamlit, and a simple model server using Keras and Flask. You will also use Keras to train a Neural Network model, and use Keras' functional API to create a model with multiple outputs. We will create a web application that will visualize the outputs of all the nodes of all the layers of the neural network for a given input image.
In order to complete this project successfully, you will need prior programming experience with Python, understanding of the theory behind neural networks, and familiarity with Keras.
Note: This course works best for learners who are based in the North America region. We’re currently working on providing the same experience in other regions.
R Programming and Tidyverse Capstone Project
In this third and final course of the "Expressway to Data Science: R Programming and Tidyverse" specialization you will reinforce and display your R and tidyverse skills by completing an analysis of COVID-19 data! Here is a chance to apply your skills to a real-world dataset that has effected all of us.
Throughout the capstone, you will import COVID-19 data; clean, tidy, and join datasets; and develop visualizations. You will also provide some analysis and interpretation to your results, preparing you for your journey into data science. By the end of the course, you will have developed a report that you can add to or use to begin a data science portfolio.
The course logo was created using images of stickers from the RStudio shop. Please visit https://swag.rstudio.com/s/shop.
Foundations: Data, Data, Everywhere
This is the first course in the Google Data Analytics Certificate. These courses will equip you with the skills you need to apply to introductory-level data analyst jobs. Organizations of all kinds need data analysts to help them improve their processes, identify opportunities and trends, launch new products, and make thoughtful decisions. In this course, you’ll be introduced to the world of data analytics through hands-on curriculum developed by Google. The material shared covers plenty of key data analytics topics, and it’s designed to give you an overview of what’s to come in the Google Data Analytics Certificate. Current Google data analysts will instruct and provide you with hands-on ways to accomplish common data analyst tasks with the best tools and resources.
Learners who complete this certificate program will be equipped to apply for introductory-level jobs as data analysts. No previous experience is necessary.
By the end of this course, you will:
- Gain an understanding of the practices and processes used by a junior or associate data analyst in their day-to-day job.
- Learn about key analytical skills (data cleaning, data analysis, data visualization) and tools (spreadsheets, SQL, R programming, Tableau) that you can add to your professional toolbox.
- Discover a wide variety of terms and concepts relevant to the role of a junior data analyst, such as the data life cycle and the data analysis process.
- Evaluate the role of analytics in the data ecosystem.
- Conduct an analytical thinking self-assessment.
- Explore job opportunities available to you upon program completion, and learn about best practices in the job search.