
Back to Courses


Data Science Courses - Page 134
Showing results 1331-1340 of 1407
Application of Data Analysis in Business with R Programming
This Guided Project “Application of Data Analysis in Business with R Programming” is for the data science learners and enthusiasts of 2 hours long. The learners will learn to discover the underlying patterns and analyse the trends in data with Data Science functions.
They will explore a Real world application of Data Analysis in the field of business.They will gain insights that will assist in suggesting recommendations or strategic decision making for optimising business and efficient allocation of resources.
This Guided Project is unique because it is a research study and analysis of data of a pandemic affected period from the year 2020.Hence, learners will study customer purchasing trends of an uncertain period marked by covid-19 where the world economy has been suffering which will also prepare learners for analysing uncertain and uneven trends.
In order to be successful, learners will need prior fundamental knowledge of R programming,Statistics and familiarity with using RStudio.
Advanced Reproducibility in Cancer Informatics
This course introduces tools that help enhance reproducibility and replicability in the context of cancer informatics. It uses hands-on exercises to demonstrate in practical terms how to get acquainted with these tools but is by no means meant to be a comprehensive dive into these tools. The course introduces tools and their concepts such as git and GitHub, code review, Docker, and GitHub actions.
Target Audience
The course is intended for students in the biomedical sciences and researchers who use informatics tools in their research. It is the follow up course to the Introduction to Reproducibility in Cancer Informatics course. Learners who take this course should:
- Have some familiarity with R or Python
- Have take the Introductory Reproducibility in Cancer Informatics course
- Have some familiarity with GitHub
Motivation
Data analyses are generally not reproducible without direct contact with the original researchers and a substantial amount of time and effort (BeaulieuJones, 2017). Reproducibility in cancer informatics (as with other fields) is still not monitored or incentivized despite that it is fundamental to the scientific method. Despite the lack of incentive, many researchers strive for reproducibility in their own work but often lack the skills or training to do so effectively.
Equipping researchers with the skills to create reproducible data analyses increases the efficiency of everyone involved. Reproducible analyses are more likely to be understood, applied, and replicated by others. This helps expedite the scientific process by helping researchers avoid false positive dead ends. Open source clarity in reproducible methods also saves researchers' time so they don't have to reinvent the proverbial wheel for methods that everyone in the field is already performing.
Curriculum
The course includes hands-on exercises for how to apply reproducible code concepts to their code. Individuals who take this course are encouraged to complete these activities as they follow along with the course material to help increase the reproducibility of their analyses.
**Goal of this course:**
To equip learners with a deeper knowledge of the capabilities of reproducibility tools and how they can apply to their existing analyses scripts and projects.
**What is NOT the goal of this course:**
To be a comprehensive dive into each of the tools discussed. .
How to use the course
Each chapter has associated exercises that you are encourage to complete in order to get the full benefit of the course
This course is designed with busy professional learners in mind -- who may have to pick up and put down the course when their schedule allows. In general, you are able to skip to chapters you find a most useful to (One incidence where a prior chapter is required is noted).
Each chapter has associated exercises that you are encourage to complete in order to get the full benefit of the course
Creating Accounting Statements Using Accounting Fundamentals
In this one and a half hour long project-based course about Creating Accounting Statements Using Accounting Fundamentals, You will be capable of recording your own transaction and even create accounting statements to your private business to observe profit and losses. By the end of this project, you will be able to understand basic accounting principals which will assist you with preparing, recording and analysing accounting statements for your own private business. You will learn how to Record transactions on journal entries, create a Trial balance, create an Income statement (A profit or loss statement) as well as create a Balance sheet (Statement of financial position)
Note: This course works best for learners who are based in the North America region. We’re currently working on providing the same experience in other regions.
Neural Style Transfer with TensorFlow
In this 2-hour long project-based course, you will learn the basics of Neural Style Transfer with TensorFlow. Neural Style Transfer is a technique to apply stylistic features of a Style image onto a Content image while retaining the Content's overall structure and complex features. We will see how to create content and style models, compute content and style costs and ultimately run a training loop to optimize a proposed image which retains content features while imparting stylistic features from another image.
This course runs on Coursera's hands-on project platform called Rhyme. On Rhyme, you do projects in a hands-on manner in your browser. You will get instant access to pre-configured cloud desktops containing all of the software and data you need for the project. Everything is already set up directly in your internet browser so you can just focus on learning. For this project, you’ll get instant access to a cloud desktop with Python, Jupyter, and Tensorflow pre-installed.
Note: This course works best for learners who are based in the North America region. We’re currently working on providing the same experience in other regions.
Blue Prism Foundation Training
Blue Prism is the global leader in robotic process automation (RPA) and intelligent automation for the enterprise, transforming the way work is done by empowering businesses to automate time-intensive, mundane tasks and to help free-up their employees to be more creative and innovative.
In this course, Blue Prism Foundation Training provides a comprehensive introduction to all of the key concepts and activities associated with configuring a Blue Prism Process Solution.
It is also the principal activity on the Developer upskilling pathway, should learners wish to attain certified Developer status.
Over the course of 12 guided weeks you will learn how to build, test, publish and manage a Blue Prism process automation.
With a comprehensive learning experience ensured via our joint approach to delivery:
-The Coursera platform will provide you with instructions for each week in the form of video demos and activity sheets, which will also explain each of the technical concepts you will encounter
-You will then put this knowledge into practice, by building your own process automation within Blue Prism
-The training concludes with an extended exercise for consolidating your skills and with signposting to further learning
This course contains subtitles in English, Japanese, Simplified Chinese, Russian, Spanish, French, Portuguese and German.
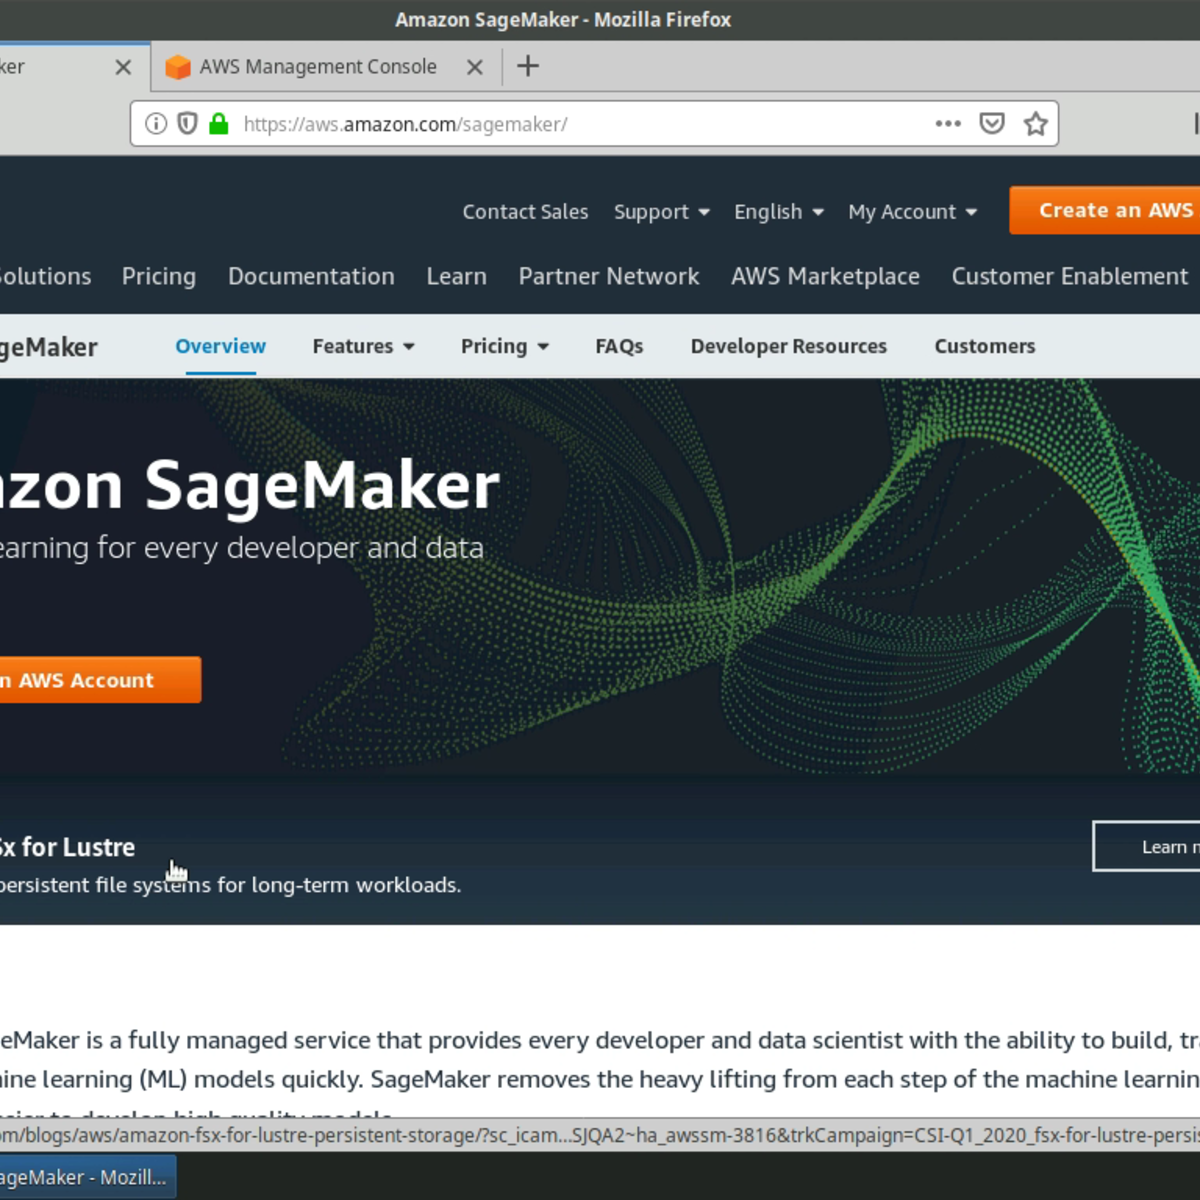
Image Classification with Amazon Sagemaker
Please note: You will need an AWS account to complete this course. Your AWS account will be charged as per your usage. Please make sure that you are able to access Sagemaker within your AWS account. If your AWS account is new, you may need to ask AWS support for access to certain resources. You should be familiar with python programming, and AWS before starting this hands on project. We use a Sagemaker P type instance in this project, and if you don't have access to this instance type, please contact AWS support and request access.
In this 2-hour long project-based course, you will learn how to train and deploy an image classifier using Amazon Sagemaker. Sagemaker provides a number of machine learning algorithms ready to be used for solving a number of tasks. We will use the image classification algorithm from Sagemaker to create, train and deploy a model that will be able to classify 37 breeds of dogs and cats from the popular IIIT-Oxford Pets Dataset.
Since this is a practical, project-based course, we will not dive in the theory behind deep learning based image classification, but will focus purely on training and deploying a model with Sagemaker. You will also need to have some experience with Amazon Web Services (AWS).
Note: This course works best for learners who are based in the North America region. We’re currently working on providing the same experience in other regions.
Cluster Analysis, Association Mining, and Model Evaluation
Welcome to Cluster Analysis, Association Mining, and Model Evaluation. In this course we will begin with an exploration of cluster analysis and segmentation, and discuss how techniques such as collaborative filtering and association rules mining can be applied. We will also explain how a model can be evaluated for performance, and review the differences in analysis types and when to apply them.
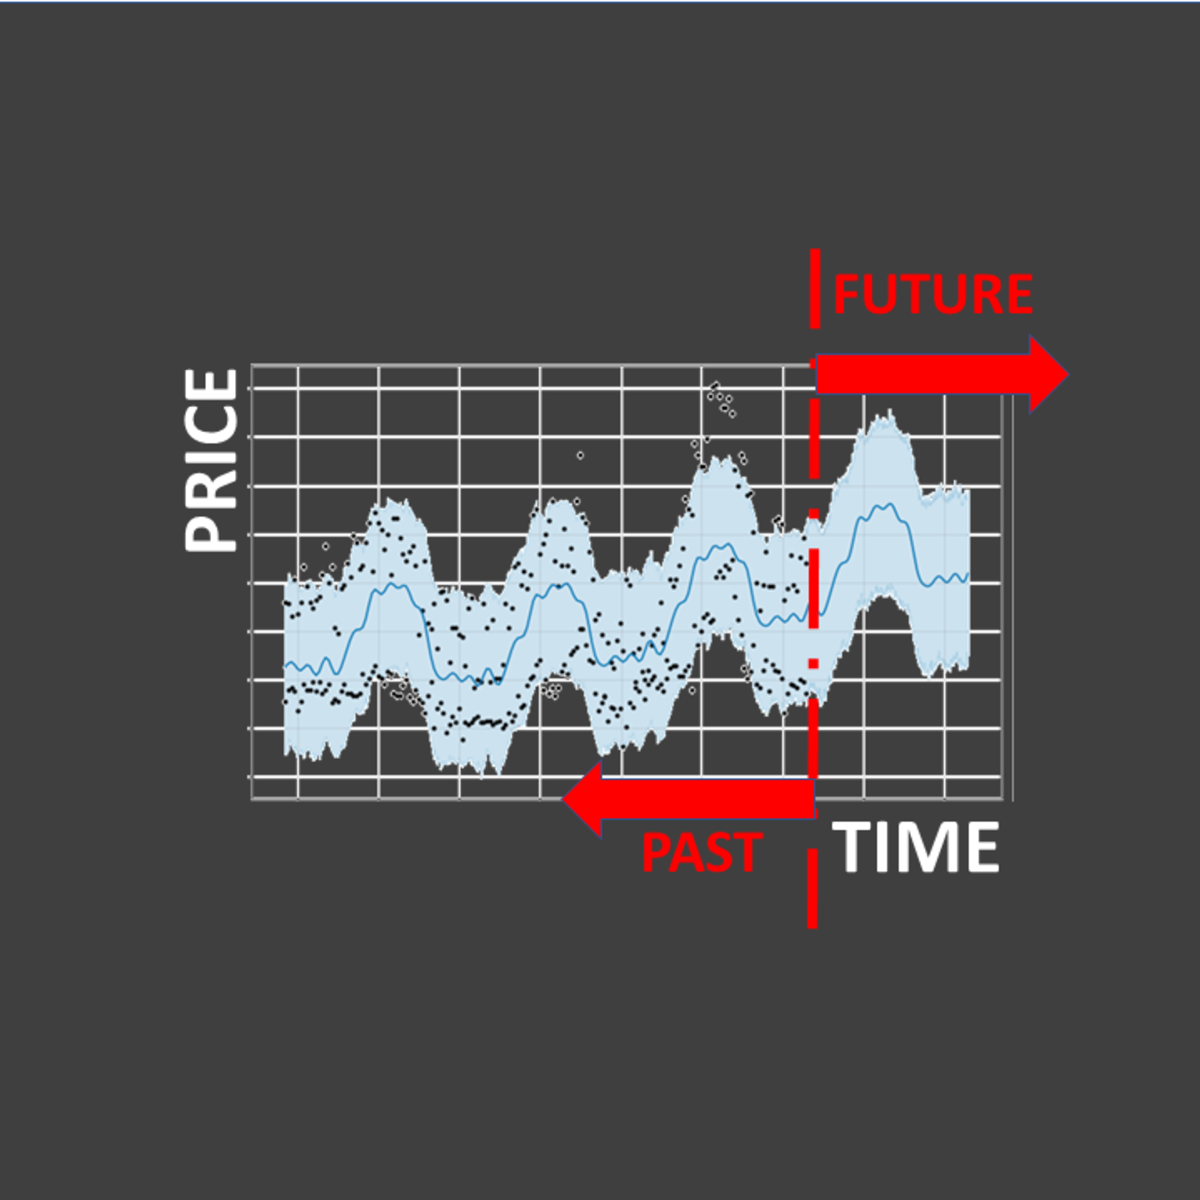
Predict Future Product Prices Using Facebook Prophet
In this 1-hour long project-based course, you will be able to:
- Understand the theory and intuition behind Facebook times series forecasting tool
- Import Key libraries, dataset and visualize dataset
- Build a time series forecasting model using Facebook Prophet to predict future product prices
- Compile and fit time series forecasting model to training data
- Assess trained model performance
Note: This course works best for learners who are based in the North America region. We’re currently working on providing the same experience in other regions.
Inferential Statistics
Inferential statistics are concerned with making inferences based on relations found in the sample, to relations in the population. Inferential statistics help us decide, for example, whether the differences between groups that we see in our data are strong enough to provide support for our hypothesis that group differences exist in general, in the entire population.
We will start by considering the basic principles of significance testing: the sampling and test statistic distribution, p-value, significance level, power and type I and type II errors. Then we will consider a large number of statistical tests and techniques that help us make inferences for different types of data and different types of research designs. For each individual statistical test we will consider how it works, for what data and design it is appropriate and how results should be interpreted. You will also learn how to perform these tests using freely available software.
For those who are already familiar with statistical testing: We will look at z-tests for 1 and 2 proportions, McNemar's test for dependent proportions, t-tests for 1 mean (paired differences) and 2 means, the Chi-square test for independence, Fisher’s exact test, simple regression (linear and exponential) and multiple regression (linear and logistic), one way and factorial analysis of variance, and non-parametric tests (Wilcoxon, Kruskal-Wallis, sign test, signed-rank test, runs test).
Excel Skills for Business: Essentials
In this first course of the specialization Excel Skills for Business, you will learn the essentials of Microsoft Excel. Within six weeks, you will be able to expertly navigate the Excel user interface, perform basic calculations with formulas and functions, professionally format spreadsheets, and create visualizations of data through charts and graphs.
Whether you are self-taught and want to fill in the gaps for better efficiency and productivity, or whether you have never used Excel before, this course will set you up with a solid foundation to become a confident user and develop more advanced skills in later courses.
The best way to learn Excel is to use Excel. In this course, learners will solve a broad range of business problems as they apply the Excel skills and techniques they learn along the way. This course uses downloadable Excel workbooks and full data sets with applied examples and practical challenge exercises. This provides learners with countless opportunities to practice their Excel skills while discovering new and useful productivity features of Excel for a variety of business contexts.
Spreadsheet software is one of the most ubiquitous pieces of software used in workplaces across the world. Learning to confidently operate this software means adding a highly valuable asset to your employability portfolio. At a time when digital skills jobs are growing much faster than non-digital jobs, make sure to position yourself ahead of the rest by adding Excel skills to your employment portfolio.