Back to Courses





Design And Product Courses - Page 44
Showing results 431-440 of 512

Create a C# UI on Linux using MonoDevelop
By the end of this project you will create a C# GTK# UI application using the Mono library and MonoDevelop IDE using a GTK# project.
MonoDevelop is an IDE that allows development of C# on the Linux operating System. It is also used as the underlying project for Visual Studio for Mac and is used for cross-platform C# application development on Mac, Linux and the Windows Operating Systems.
Note: This course works best for learners who are based in the North America region. We’re currently working on providing the same experience in other regions.

How to align and distribute with Adobe Illustrator
During this project, you’ll use the Align and Distribute panel in Adobe Illustrator to create a poster of solar eclipse phases. You’ll use align and distribute commands to get precise control over the position of each object, relative to the artboard and relative to other vector objects.
By the end of this project, you’ll be comfortable aligning vector objects and text to create clear, informative, and interesting compositions.

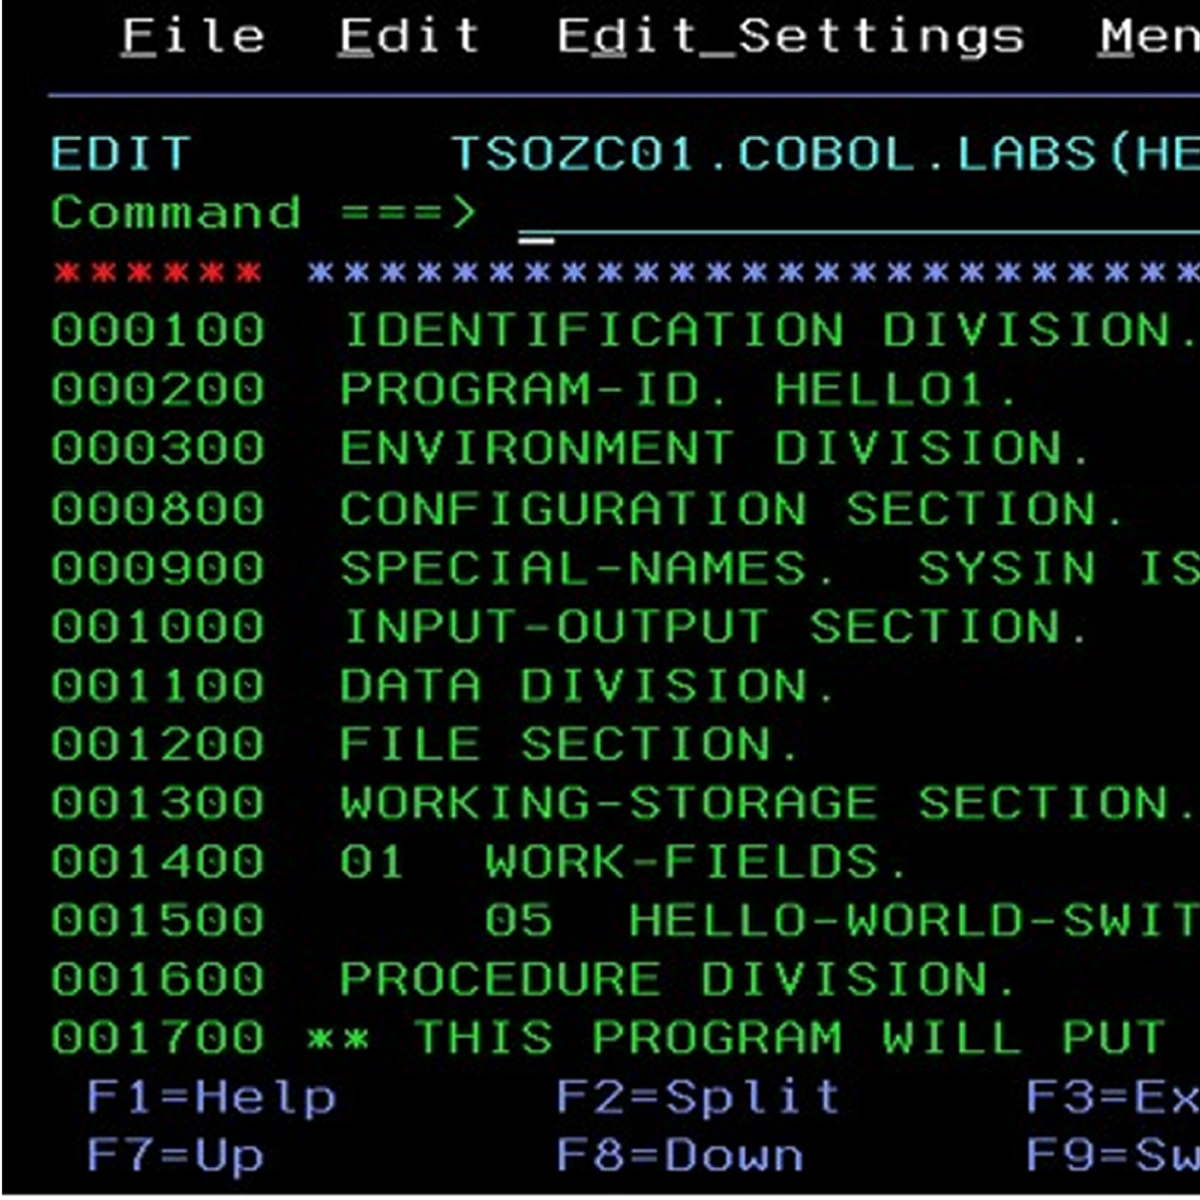
IBM COBOL Basic Testing and Debugging
Welcome to IBM COBOL – Basic Testing and Debugging! By enrolling in this course, you are taking a big step in increasing your knowledge and hands on experience with IBM COBOL testing and debugging topics and technologies. In this course, you will describe common errors associated with working with COBOL. You will list file status codes. You will also describe the process of debugging COBOL code. So let’s get started!

Communicate UX Research with Empathy Maps in Miro
By the end of this project, you will be able to leverage applied empathy to interpret User Experience research so that it can be effectively communicated within an empathy map visualization.
To do this, you will gain hands-on experience applying design thinking, empathy, and context from User Experience research to create an empathy map in the Miro online visual collaboration platform for teamwork.
Note: This course works best for learners who are based in the North America region. We’re currently working on providing the same experience in other regions.
Description Design for Interactive Learning Resources
This course gives you easy access to an innovative description design framework used and created by experts in description design who design descriptions for highly interactive learning resources.
Interactive learning resources are common, fun, and effective tools that engage learners in the classroom and in remote learning environments. Many of these interactives rely on the visual display. This limits non-visual experiences, and makes many interactive learning resources inaccessible to learners with significant visual impairments or print- and graphics-related disabilities. Descriptions are verbalized text for supporting non-visual access.
This course will show you how to create descriptions, the verbalized text, needed to make interactive learning resources (interactives) accessible to learners who are blind or have a visual impairment (learners with BVI). The course weaves together concepts from inclusive design, web accessibility, and general best practices for description design for non-visual access. The main focus of the course is learning about and using the Description Design Framework created by design researchers at PhET Interactive Simulations.
Through a series of design tasks, each preempted with examples and demonstrations, the course walks you through how to design descriptions for an interactive of your choosing. While prior experience in web accessibility, interaction design, and description is useful, it is not required for this course. We share many examples from our work, and include tips and design patterns that we have created and actively use to describe our highly interactive science and math simulations. If you have an interest in creating descriptions for interactive learning resources, join us in this course. The Description Design Framework helps us take a methodical approach to the challenging task of designing descriptions for interactives, and we want to share what we know so others can design engaging descriptions that support non-visual access to interactive learning resources.

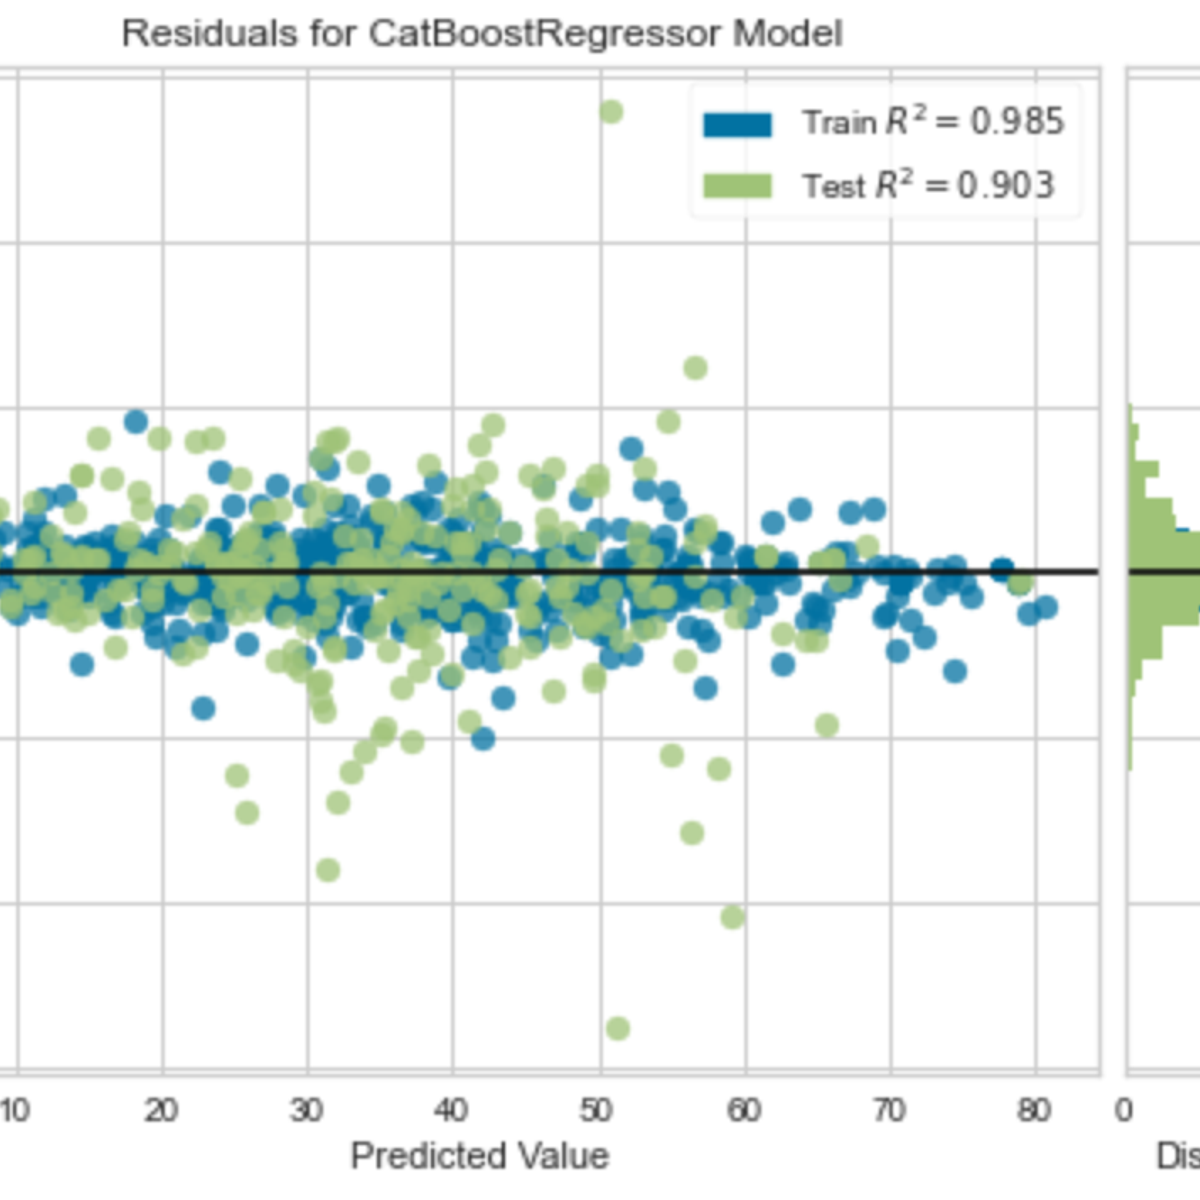
Build a Regression Model using PyCaret
In this 1-hour long project-based course, you will create an end-to-end Regression model using PyCaret a low-code Python open-source Machine Learning library.
The goal is to build a model that can accurately predict the strength of concrete based on several fatures.
You will learn how to automate the major steps for building, evaluating, comparing and interpreting Machine Learning Models for regression.
Here are the main steps you will go through: frame the problem, get and prepare the data, discover and visualize the data, create the transformation pipeline, build, evaluate, interpret and deploy the model.
This guided project is for seasoned Data Scientists who want to build a accelerate the efficiency in building POC and experiments by using a low-code library. It is also for Citizen data Scientists (professionals working with data) by using the low-code library PyCaret to add machine learning models to the analytics toolkit
In order to be successful in this project, you should be familiar with Python and the basic concepts on Machine Learning
Note: This course works best for learners who are based in the North America region. We’re currently working on providing the same experience in other regions.

Testing and Debugging Python
If you have seen any of the news lately, it is not hard to imagine why software bugs cost the economy billions of dollars per year as well as costing lives. The ability to test your code (and other’s code) is probably one of the most important skills to know as a developer. Knowing how to track down and fix bugs is also critical.
Testing can mean adding print statements to output data at certain points in a program to visually check it. Testing can also involve developing separate programs to test the functionality of the code itself.
In this course, you will create a Python application that implements a new sorting algorithm. You will also create a test to sort the algorithm, and use debugging to find bugs in the code.
Note: This course works best for learners who are based in the North America region. We’re currently working on providing the same experience in other regions.

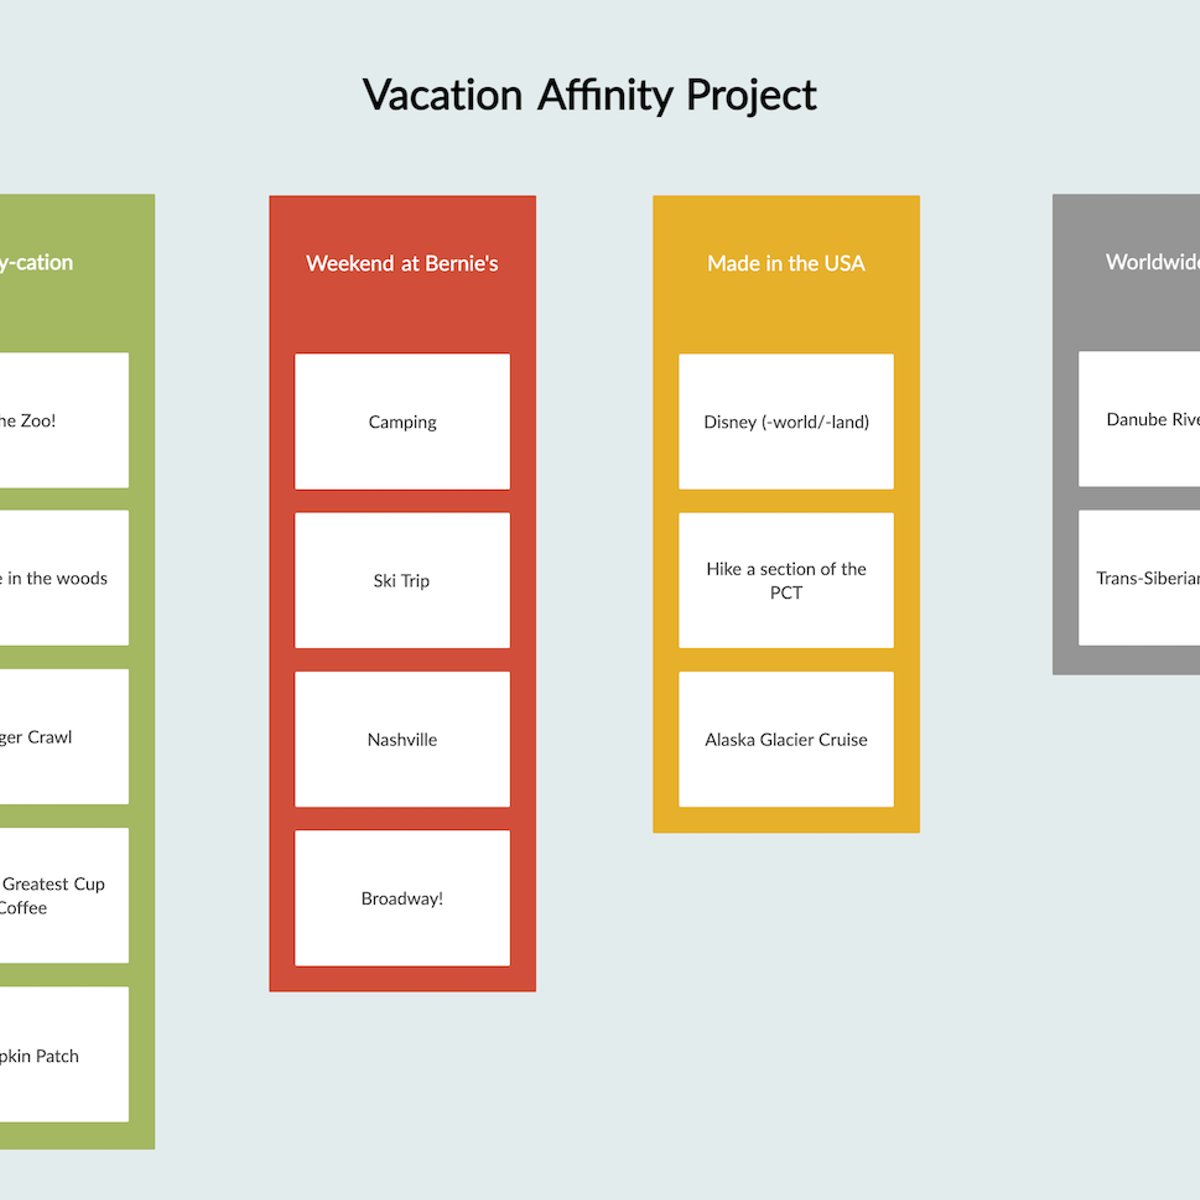
Create an Affinity Diagram Using Creately
By the end of this project you will create an affinity diagram using Creately.com. Learning to collect and organize ideas and information increases productivity and fosters positive teamwork. Learners will engage in the Affinity process to develop an understanding of how to spark, gather, consolidate, sort and present ideas and information.

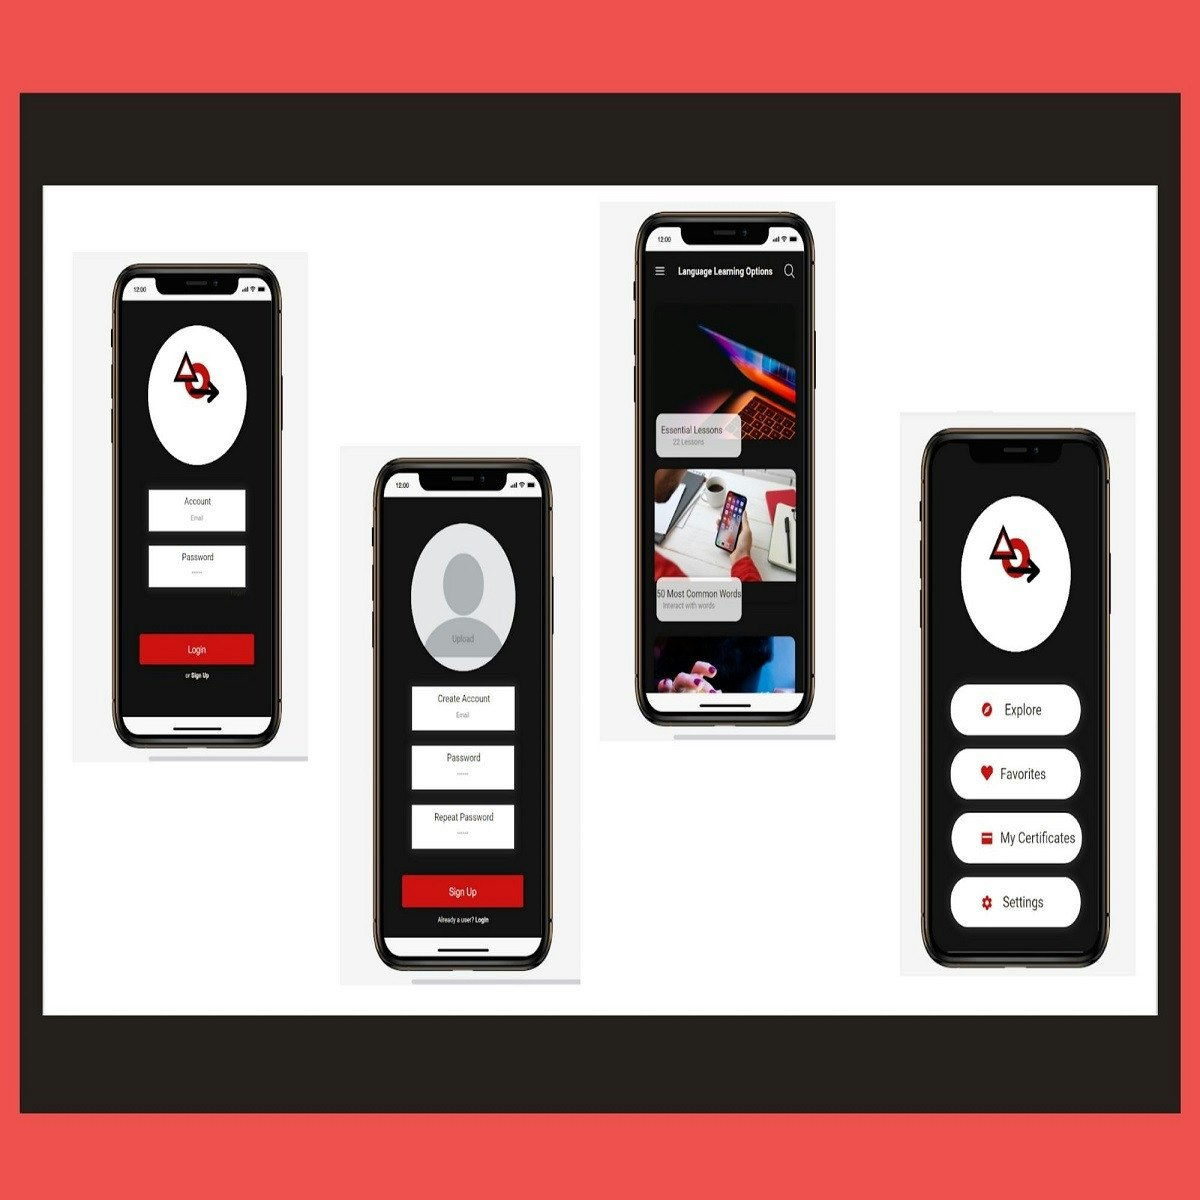
Design an App with Mockitt
What was the app that you used today? Picture it in your mind, and now think about how that app was developed. You use apps in your everyday life. Now is the chance for you to experience the process an app goes through to be developed. In this project, you will use Wondershare Mockitt to design and develop an app, going from a prototype to an app that you can share with others.

Design corporate presentations with Piktochart
At the end of this project, you will have all the basic skills to create a professional business presentation with Piktochart, an online tool for creating and editing infographics and Marketing visuals of all kinds. You will be able to discover in detail the different features of the platform, and will be able to use its tools to create a professional, understandable and fun presentation.
Popular Internships and Jobs by Categories
Browse
© 2024 BoostGrad | All rights reserved


