Back to Courses


Economics Courses - Page 3
Showing results 21-30 of 99
Microeconomics Principles
Most people make the incorrect assumption that economics is ONLY the study of money. My primary goal in this course is to shatter this belief. During this course, we will be addressing the above questions as well as many more relating to:
-the environment
-love and marriage
-crime
-labor markets
-education
-politics
-sports
-business
My main goal is to show you the way economists think and how to use this analytical system to answer questions related not only to these and other important human issues but to anything you end up doing with your life after this class. After all, as you will quickly find out, I believe that everything is economics!
Quantitative Text Analysis and Textual Similarity in R
By the end of this project, you will learn about the concept of document similarity in textual analysis in R. You will know how to load and pre-process a data set of text documents by converting the data set into a corpus and document feature matrix. You will know how to calculate the cosine similarity between documents and explore and plot the output of your calculation.
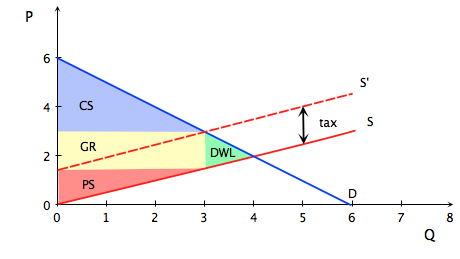
Microeconomics: When Markets Fail
Perfect markets achieve efficiency: maximizing total surplus generated. But real markets are imperfect. In this course we will explore a set of market imperfections to understand why they fail and to explore possible remedies including as antitrust policy, regulation, government intervention. Examples are taken from everyday life, from goods and services that we all purchase and use. We will apply the theory to current events and policy debates through weekly exercises. These will empower you to be an educated, critical thinker who can understand, analyze and evaluate market outcomes.
Introduction to Financial Engineering and Risk Management
Introduction to Financial Engineering and Risk Management course belongs to the Financial Engineering and Risk Management Specialization and it provides a fundamental introduction to fixed income securities, derivatives and the respective pricing models. The first module gives an overview of the prerequisite concepts and rules in probability and optimization. This will prepare learners with the mathematical fundamentals for the course. The second module includes concepts around fixed income securities and their derivative instruments. We will introduce present value (PV) computation on fixed income securities in an arbitrage free setting, followed by a brief discussion on term structure of interest rates. In the third module, learners will engage with swaps and options, and price them using the 1-period Binomial Model. The final module focuses on option pricing in a multi-period setting, using the Binomial and the Black-Scholes Models. Subsequently, the multi-period Binomial Model will be illustrated using American Options, Futures, Forwards and assets with dividends.
The Economics of Agro-Food Value Chains
Have a look at our trailer for a brief introduction to this course: https://youtu.be/GADAgxTHjgE
In this course, you learn how the agro-food value chain approaches the challenge of constantly improving its competitiveness by producing high quality food and products and also aiming to attain greater sustainability. Some of the topics of this course are:
• The notion of quality for food and agricultural products and consumer value.
• How to conduct market research in this field.
• Labelling, branding and pricing strategies, as-well as innovation in the agro-food sector.
• How sustainability can be used as a competitive advantage through corporate social responsibility.
• The role and different types of industrial standards.
• The different forms of coordination in the chain, in particular with regard to the retailing and distribution sector.
This course is taught by a group of international experts from Universities in Italy, Germany, Ireland, Scotland and the Netherlands. Each of them will give you insights into a specific topic related to food quality and the organization of the agro-food value chains.
The Economics of AI
The course introduces you to cutting-edge research in the economics of AI and the implications for economic growth and labor markets. We start by analyzing the nature of intelligence and information theory. Then we connect our analysis to modeling production and technological change in economics, and how these processes are affected by AI. Next we turn to how technological change drives aggregate economic growth, covering a range of scenarios including a potential growth singularity. We also study the impact of AI-driven technological change on labor markets and workers, evaluating to what extent fears about technological unemployment are well-founded. We continue with an analysis of economic policies to deal with advanced AI. Finally, we evaluate the potential for transformative progress in AI to lead to significant disruptions and study the problem of how humans can control highly intelligent AI algorithms.
Arctic Economy
Arctic communities have diverse histories and roles in local, regional and global economies. However, the scope and scale of globalization has increased so quickly that vulnerable Arctic communities are facing new kinds of challenges to their survival. In this 3-week MOOC, a unique collaboration between the University of Alberta and UiT The Arctic University of Norway, you will investigate the challenges faced by Indigenous, North American, Russian and Nordic Arctic communities in a modern world. So join us as we venture above the 60th parallel North, and explore how these fascinating communities adjust to change while maintaining their ways of life, socio-economic histories, and cultural traditions.
Earth Economics
After this course you will be an Earth Economist that can provide evidence-based advise on the best global policy. As an Earth Economist you will better understand the behavior and advice of economists, have become a better economist yourself and know where to find Earth's data and how to analyze these world observations. Our planet is too important: we need you to get engaged!
Earth Economics offers a completely new angle to policy analysis by its focus on the truly global level and its empirical orientation on very recent data. Sustainability (environmental and related to the UN's SDGs), equality and heterodox (that is: non mainstream) views on the economy are important for an Earth Economist. Taking stock of emerging planet data and analyzing policies during and following the Global Crisis, Earth Economics provides both a topical introduction into basic economic tools and concepts as well as insights in highly relevant problems and recent developments in planet production, growth and governance. An important issue is the provision of global public goods. Earth Economics highlights the importance of the United Nations, International Monetary Fund, the World Health Organization and the World Trade Organization.
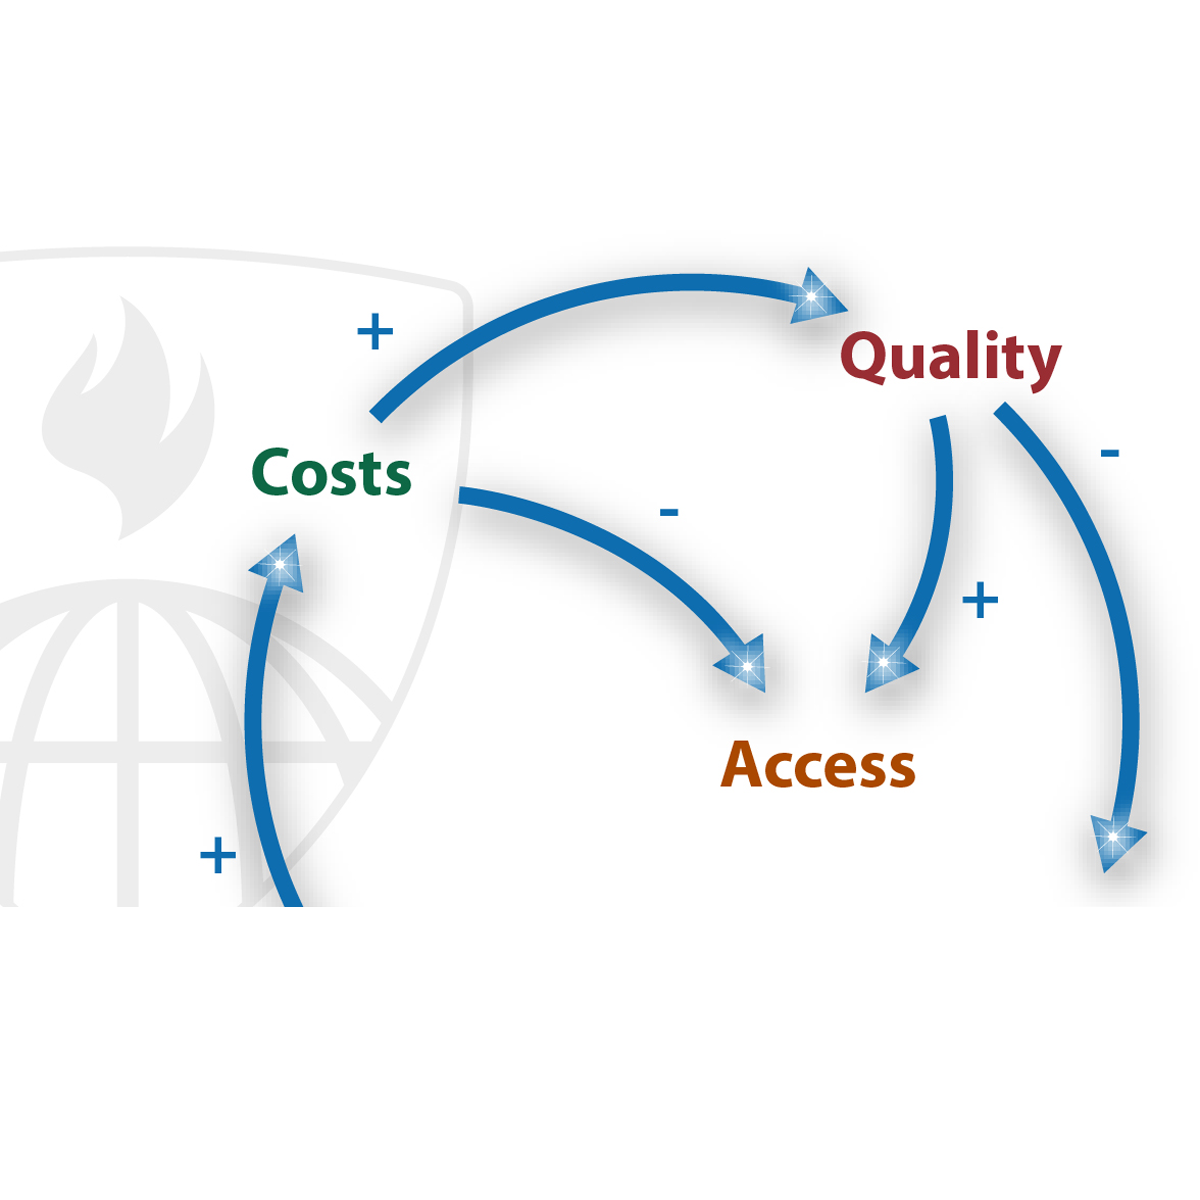
Systems Thinking In Public Health
This course provides an introduction to systems thinking and systems models in public health. Problems in public health and health policy tend to be complex with many actors, institutions and risk factors involved. If an outcome depends on many interacting and adaptive parts and actors the outcome cannot be analyzed or predicted with traditional statistical methods. Systems thinking is a core skill in public health and helps health policymakers build programs and policies that are aware of and prepared for unintended consequences.
An important part of systems thinking is the practice to integrate multiple perspectives and synthesize them into a framework or model that can describe and predict the various ways in which a system might react to policy change. Systems thinking and systems models devise strategies to account for real world complexities.
This work was coordinated by the Alliance for Health Policy and Systems Research, the World Health Organization, with the aid of a grant from the International Development Research Centre, Ottawa, Canada. Additional support was provided by the Department for International Development (DFID) through a grant (PO5467) to Future Health Systems research consortium.
© World Health Organization 2014
All rights reserved. The designations employed and the presentation of the material in this publication do not imply the expression of any opinion whatsoever on the part of the World Health Organization concerning the legal status of any country, territory, city or area or of its authorities, or concerning the delimitation of its frontiers or boundaries. Dotted and dashed lines on maps represent approximate border lines for which there may not yet be full agreement. The mention of specific companies or of certain manufacturers’ products does not imply that they are endorsed or recommended by the World Health Organization in preference to others of a similar nature that are not mentioned. Errors and omissions excepted, the names of proprietary products are distinguished by initial capital letters. All reasonable precautions have been taken by the World Health Organization to verify the information contained in this publication. However, the published material is being distributed without warranty of any kind, either expressed or implied. The responsibility for the interpretation and use of the material lies with the reader. In no event shall the World Health Organization be liable for damages arising from its use. Johns Hopkins University Bloomberg School of Public Health has a non-exclusive license to use and reproduce the material.
Quantitative Text Analysis and Measures of Readability in R
By the end of this project, you will be able to load textual data into R and turn it into a corpus object. You will also understand the concept of measures of readability in textual analysis. You will know how to estimate the level of readability of a text document or corpus of documents using a number of different readability metrics and how to plot the variation in readability levels in a text document corpus over time at the document and paragraph level.
This project is aimed at beginners who have a basic familiarity with the statistical programming language R and the RStudio environment, or people with a small amount of experience who would like to learn how to measure the readability of textual data.
Popular Internships and Jobs by Categories
Find Jobs & Internships
Browse


© 2024 BoostGrad | All rights reserved