Back to Courses


Probability And Statistics Courses - Page 5
Showing results 41-50 of 133

Statistics for Machine Learning for Investment Professionals
One of the biggest changes in the past decade is the rapid adoption of machine learning, AI, and big data in investment decision making. This course introduces learners with knowledge of the investment industry to foundational statistical concepts underpinning machine learning as well as advanced AI techniques. This course demonstrates core modeling frameworks along with carefully selected real-world investment practice examples. The course seeks to familiarize learners with two important programming languages — Python and R (no prior knowledge of Python or R necessary). The motivation is to demonstrate the elegance — and speed — simple programming brings to the investment decision-making process. The reading material in this course offers in-practice insights curated from the blogs of CFA Institute as well as other leading publications.
After taking this course you will be able to:
- Describe the importance of identifying information patterns for building models
- Explain probability concepts for solving investing problems
- Explain the use of linear regression and interpret related Python and R code
- Describe gradient descent, explain logistic regression, and interpret Python and R code
- Describe the characteristics and uses of time-series models
This course is part of the Data Science for Investment Professionals Specialization offered by CFA Institute.

Linear Regression in R for Public Health
Welcome to Linear Regression in R for Public Health!
Public Health has been defined as “the art and science of preventing disease, prolonging life and promoting health through the organized efforts of society”. Knowing what causes disease and what makes it worse are clearly vital parts of this. This requires the development of statistical models that describe how patient and environmental factors affect our chances of getting ill. This course will show you how to create such models from scratch, beginning with introducing you to the concept of correlation and linear regression before walking you through importing and examining your data, and then showing you how to fit models. Using the example of respiratory disease, these models will describe how patient and other factors affect outcomes such as lung function.
Linear regression is one of a family of regression models, and the other courses in this series will cover two further members. Regression models have many things in common with each other, though the mathematical details differ.
This course will show you how to prepare the data, assess how well the model fits the data, and test its underlying assumptions – vital tasks with any type of regression.
You will use the free and versatile software package R, used by statisticians and data scientists in academia, governments and industry worldwide.

Optimization for Decision Making
In this data-driven world, companies are often interested in knowing what is the "best" course of action, given the data. For example, manufacturers need to decide how many units of a product to produce given the estimated demand and raw material availability? Should they make all the products in-house or buy some from a third-party to meet the demand? Prescriptive Analytics is the branch of analytics that can provide answers to these questions. It is used for prescribing data-based decisions. The most important method in the prescriptive analytics toolbox is optimization. This course will introduce students to the basic principles of linear optimization for decision-making. Using practical examples, this course teaches how to convert a problem scenario into a mathematical model that can be solved to get the best business outcome. We will learn to identify decision variables, objective function, and constraints of a problem, and use them to formulate and solve an optimization problem using Excel solver and spreadsheet.

Basic Statistics in Python (ANOVA)
In this 1-hour long project-based course, you will learn how to set up a Google Colab notebook, source data from the internet, load data into Python, merge two datasets, clean data, perform exploratory data analysis, carry out ANOVA and create boxplots. Throughout the course you will work on an Education dataset from World Bank. This will allow you to perform statistical analysis on your own datasets in Python. This project does not require any previous Python or coding experience, but it would be useful for learners to understand the statistical methods covered. The course includes data sourcing and cleaning which are invaluable real world skills, and focuses on visualizing your results which is needed as a large part of any analysis is the storytelling.

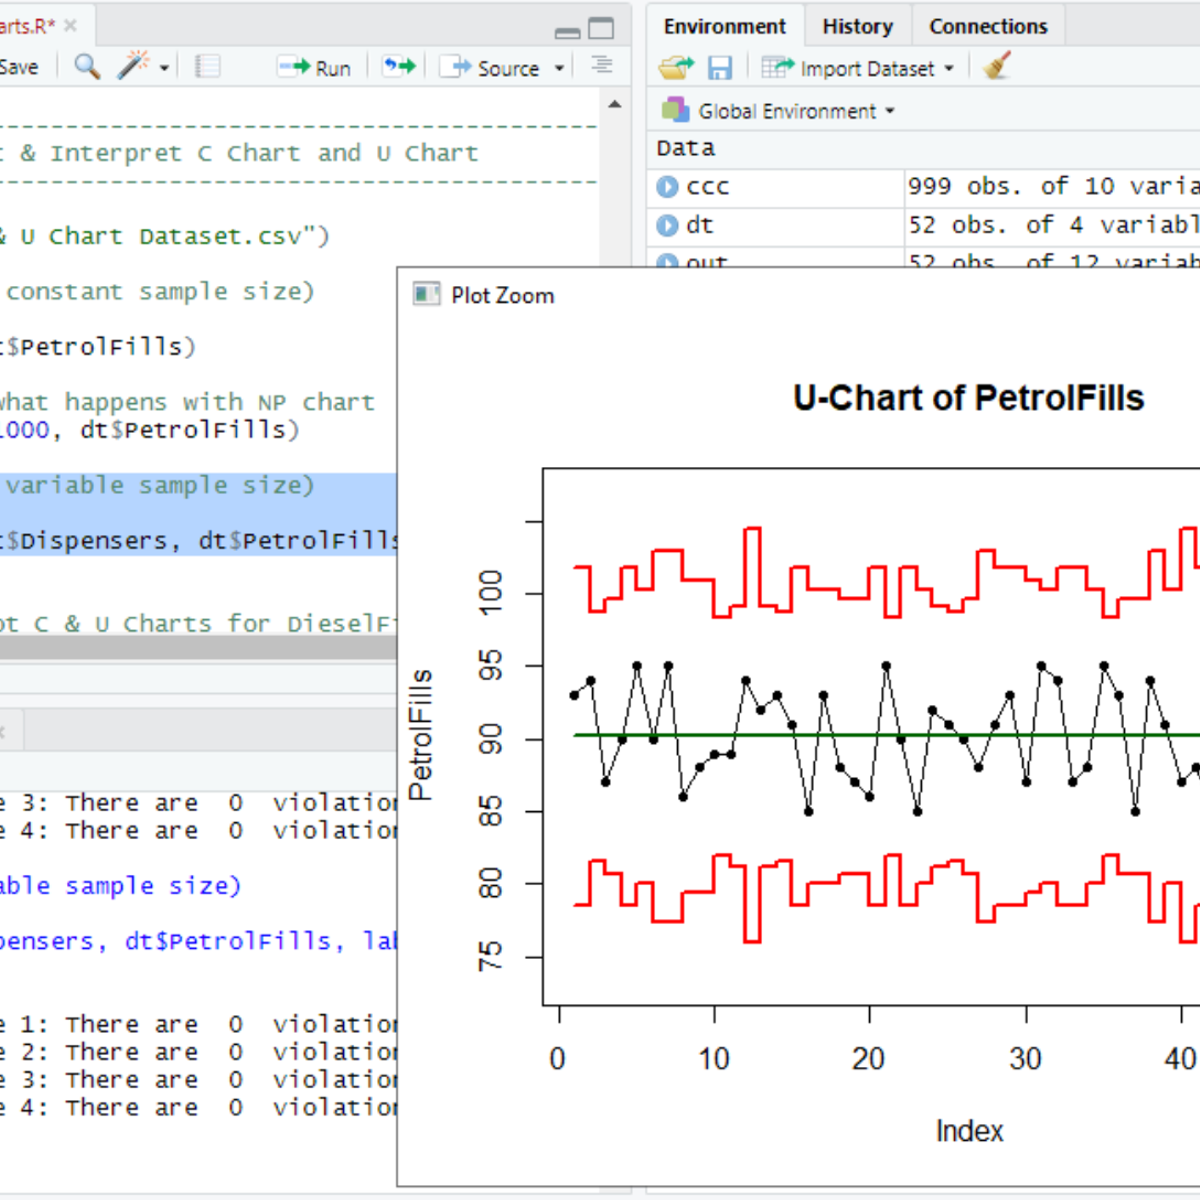
RStudio for Six Sigma - Control Charts
Welcome to RStudio for Six Sigma - Control Charts. This is a project-based course which should take under 2 hours to finish. Before diving into the project, please take a look at the course objectives and structure.
By the end of this project, you will learn to identify data types (Variables, Attribute Type I & II), understand the overview of Statistical Process Control, pick the right Control Chart based on the data type and other criteria, plot and interpret control charts. This Guided Project covers IMR Charts (XMR), Xbar-R Charts, Xbar-S Charts, NP Chart, P Chart, C Chart and U Chart. You will also learn about Western Electric Rules and Nelson's rules used to interpret the stability of the process.

Improving Your Statistical Questions
This course aims to help you to ask better statistical questions when performing empirical research. We will discuss how to design informative studies, both when your predictions are correct, as when your predictions are wrong. We will question norms, and reflect on how we can improve research practices to ask more interesting questions. In practical hands on assignments you will learn techniques and tools that can be immediately implemented in your own research, such as thinking about the smallest effect size you are interested in, justifying your sample size, evaluate findings in the literature while keeping publication bias into account, performing a meta-analysis, and making your analyses computationally reproducible.
If you have the time, it is recommended that you complete my course 'Improving Your Statistical Inferences' before enrolling in this course, although this course is completely self-contained.
Tracking Objects in Video with Particle Filters
In this one hour long project-based course, you will tackle a real-world computer vision problem. We will be locating and tracking a target in a video shot with a digital camera. We will encounter some of the classic challenges that make computer vision difficult: noisy sensor data, objects that change shape, and occlusion (object hidden from view).
We will tackle these challenges with an artificial intelligence technique called a particle filter.
By the end of this project, you will have coded a particle filter from scratch using Python and numpy.
Note: This course works best for learners who are based in the North America region. We’re currently working on providing the same experience in other regions.

Algebra and Differential Calculus for Data Science
Are you interested in Data Science but lack the math background for it? Has math always been a tough subject that you tend to avoid? This course will teach you the most fundamental Calculus concepts that you will need for a career in Data Science without a ton of unnecessary proofs and techniques that you may never use. Consider this an expressway to Data Science with approachable methods and friendly concepts that will guide you to truly understanding the most important ideas in Differential Calculus. We will review some algebra basics, talk about what a derivative is, compute some simple derivatives and apply the basics of derivatives to graphing and maximizing functions.
This course is designed to prepare learners to successfully complete Statistical Modeling for Data Science Application, which is part of CU Boulder's Master of Science in Data Science (MS-DS) program.
Logo courtesy of ThisisEngineering RAEng on Unsplash.com

Enjoyable Econometrics
The goal of this MOOC is to show that econometric methods are often needed to answer questions. A question comes first, then data are to be collected, and then finally the model or method comes in. Depending on the data, however, it can happen that methods need to be adapted. For example, where we first look at two variables, later we may need to look at three or more. Or, when data are missing, what then do we do? And, if the data are counts, like the number of newspaper articles citing someone, then matters may change too. But these modifications always come last, and are considered only when relevant.
An important motivation for me to make this MOOC is to emphasize that econometric models and methods can also be applied to more unconventional settings, which are typically settings where the practitioner has to collect his or her own data first. Such collection can be done by carefully combining existing databases, but also by holding surveys or running experiments. A byproduct of having to collect your own data is that this helps to choose amongst the potential methods and techniques that are around.
If you are searching for a MOOC on econometrics that treats (mathematical and statistical) methods of econometrics and their applications, you may be interested in the Coursera course “Econometrics: Methods and Applications” that is also from Erasmus University Rotterdam.

Statistical Inference
Statistical inference is the process of drawing conclusions about populations or scientific truths from data. There are many modes of performing inference including statistical modeling, data oriented strategies and explicit use of designs and randomization in analyses. Furthermore, there are broad theories (frequentists, Bayesian, likelihood, design based, …) and numerous complexities (missing data, observed and unobserved confounding, biases) for performing inference. A practitioner can often be left in a debilitating maze of techniques, philosophies and nuance. This course presents the fundamentals of inference in a practical approach for getting things done. After taking this course, students will understand the broad directions of statistical inference and use this information for making informed choices in analyzing data.
Popular Internships and Jobs by Categories
Find Jobs & Internships
Browse
© 2024 BoostGrad | All rights reserved