Back to Courses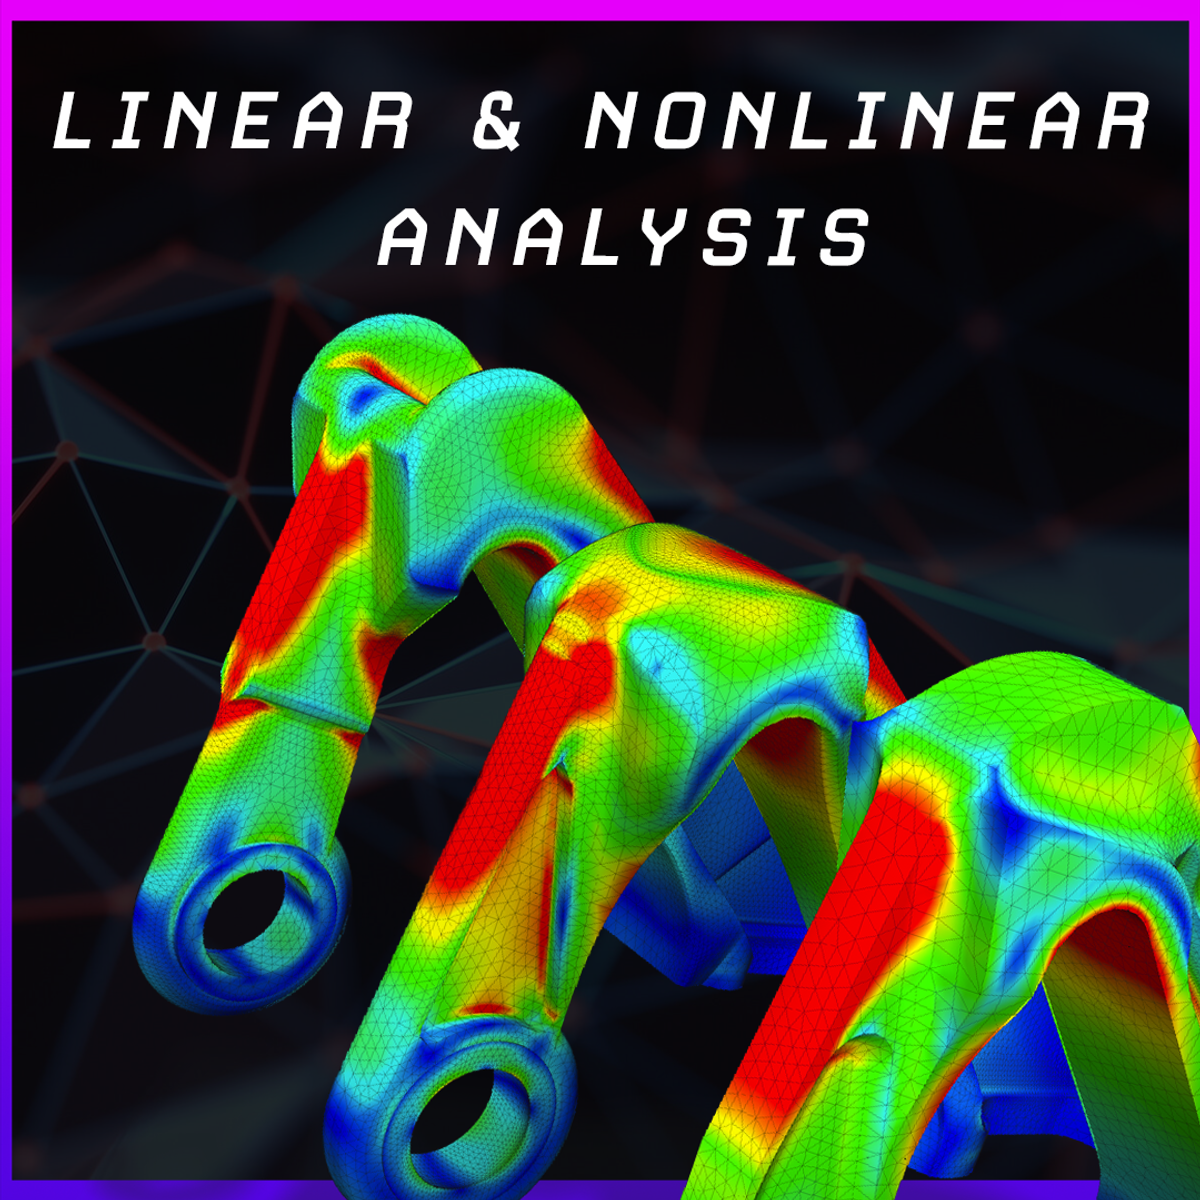


Research Methods Courses - Page 5
Showing results 41-48 of 48
FEM - Linear, Nonlinear Analysis & Post-Processing
In this hands-on project, you will learn about the Finite Element Method (FEM) and perform a linear & nonlinear static analysis study using the cloud-based simulation tool SimScale. We will set up simulation cases with provided geometries to learn the fundamentals of the Finite Element Method and how a static linear and nonlinear analysis is approached in the first place. We will walk through the classical three step process of every simulation which includes the pre-processing, processing and post-processing step.
SimScale is an engineering simulation platform that is revolutionizing the way engineers, designers, scientists, and students design products. The SimScale platform is accessible completely via a standard web browser, with an easy-to-use interface which supports numerous simulation types including solid mechanics (FEM), fluid dynamics (CFD) & thermodynamics.
This course runs on Coursera's hands-on project platform called Rhyme. On Rhyme, you do projects in a hands-on manner in your browser. You will get instant access to pre-configured cloud desktops containing all of the software and data you need for the project, for this project you need no special setup or any data. Everything is already set up directly in your internet browser so you can just focus on learning!
Notes:
- This course works best for learners who are based in the North America region. We’re currently working on providing the same experience in other regions.
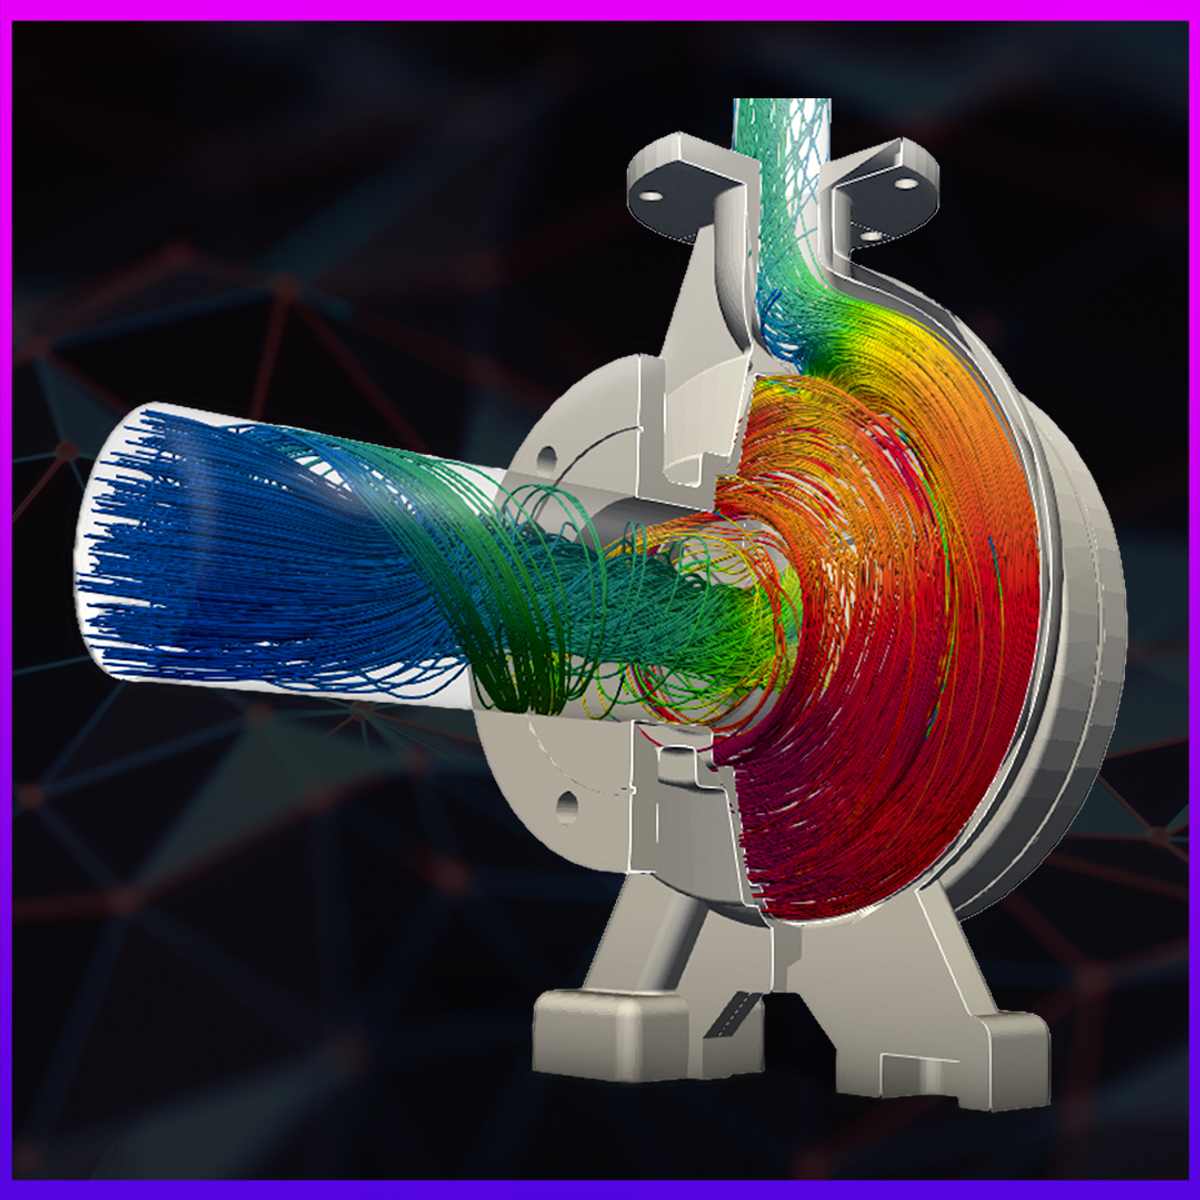
CFD Simulation Through a Centrifugal Pump
In this hands-on project, you will learn about Computational Fluid Dynamics (CFD) and perform a pump simulation using the cloud-based simulation tool SimScale. We will set up simulation cases with provided geometries to learn the fundamentals of CFD and how a pump simulation is approached and set up in the first place. We will walk through the classical three step process of every simulation which includes the pre-processing, processing and post-processing step.
SimScale is an engineering simulation platform that is revolutionizing the way engineers, designers, scientists, and students design products. The SimScale platform is accessible completely via a standard web browser, with an easy-to-use interface which supports numerous simulation types including solid mechanics (FEM), fluid dynamics (CFD) & thermodynamics.
This course runs on Coursera's hands-on project platform called Rhyme. On Rhyme, you do projects in a hands-on manner in your browser. You will get instant access to pre-configured cloud desktops containing all of the software and data you need for the project, for this project you need no special setup or any data. Everything is already set up directly in your internet browser so you can just focus on learning!
Notes:
- This course works best for learners who are based in the North America region. We’re currently working on providing the same experience in other regions.
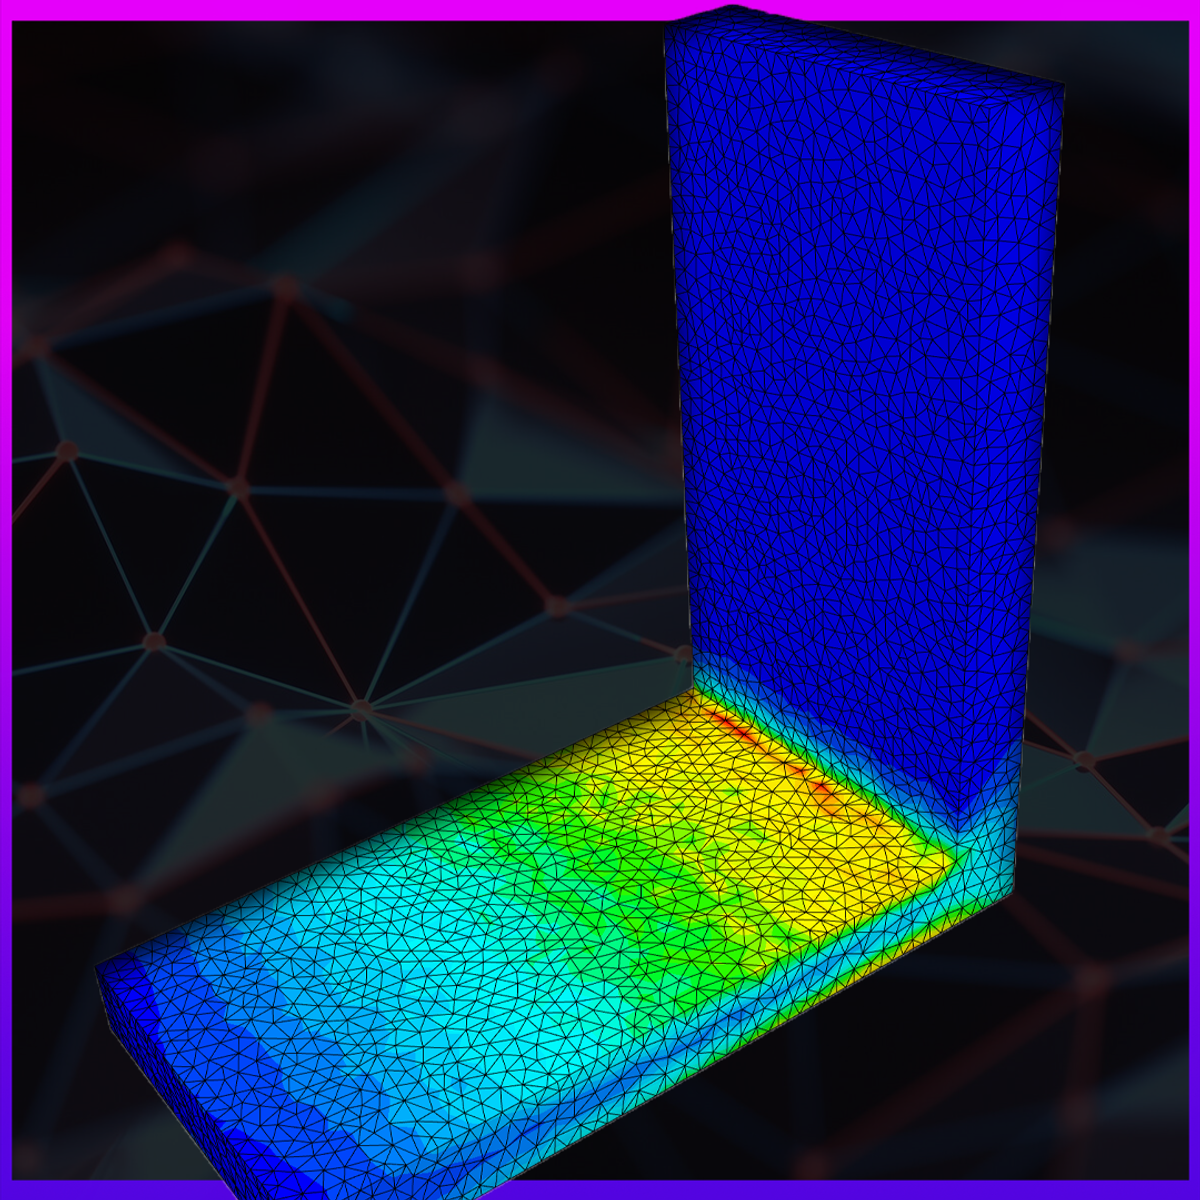
Finite Element Analysis Convergence and Mesh Independence
In this hands-on project, you will learn about the Finite Element Method (FEM) and perform a convergence study using the cloud-based simulation tool SimScale. We will set up a simple simulation case with a provided geometry to learn the fundamentals of the Finite Element Method and how a convergence study is approached in the first place. We will walk through the classical three step process of every simulation which includes the pre-processing, processing and post-processing step.
SimScale is an engineering simulation platform that is revolutionizing the way engineers, designers, scientists, and students design products. The SimScale platform is accessible completely via a standard web browser, with an easy-to-use interface which supports numerous simulation types including solid mechanics (FEM), fluid dynamics (CFD) & thermodynamics.
This course runs on Coursera's hands-on project platform called Rhyme. On Rhyme, you do projects in a hands-on manner in your browser. You will get instant access to pre-configured cloud desktops containing all of the software and data you need for the project, for this project you need no special setup or any data. Everything is already set up directly in your internet browser so you can just focus on learning!
Notes:
- This course works best for learners who are based in the North America region. We’re currently working on providing the same experience in other regions.
Plant Bioinformatics
The past 15 years have been exciting ones in plant biology. Hundreds of plant genomes have been sequenced, RNA-seq has enabled transcriptome-wide expression profiling, and a proliferation of "-seq"-based methods has permitted protein-protein and protein-DNA interactions to be determined cheaply and in a high-throughput manner. These data sets in turn allow us to generate hypotheses at the click of a mouse. For instance, knowing where and when a gene is expressed can help us narrow down the phenotypic search space when we don't see a phenotype in a gene mutant under "normal" growth conditions. Coexpression analyses and association networks can provide high-quality candidate genes involved in a biological process of interest. Using Gene Ontology enrichment analysis and pathway visualization tools can help us make sense of our own 'omics experiments and answer the question "what processes/pathways are being perturbed in our mutant of interest?"
Structure: each of the 6 week hands-on modules consists of a ~2 minute intro, a ~20 minute theory mini-lecture, a 1.5 hour hands-on lab, an optional ~20 minute lab discussion if experiencing difficulties with lab, and a ~2 minute summary.
Tools covered [Material updated in June 2022]:
Module 1: GENOMIC DBs / PRECOMPUTED GENE TREES / PROTEIN TOOLS. Araport, TAIR, Gramene, EnsemblPlants Compara, PLAZA; SUBA4 and Cell eFP Browser, 1001 Genomes Browser
Module 2: EXPRESSION TOOLS. eFP Browser / eFP-Seq Browser, Araport, Genevestigator, TravaDB, NCBI Genome Data Viewer for exploring RNA-seq data for many plant species, MPSS database for small RNAs
Module 3: COEXPRESSION TOOLS. ATTED II, Expression Angler, AraNet, AtCAST2
Module 4: PROMOTER ANALYSIS. Cistome, MEME, ePlant
Module 5: GO ENRICHMENT ANALYSIS AND PATHWAY VIZUALIZATION. AgriGO, AmiGO, Classification SuperViewer, TAIR, g:profiler, AraCyc, MapMan (optional: Plant Reactome)
Module 6: NETWORK EXPLORATION. Arabidopsis Interactions Viewer 2, ePlant, TF2Network, Virtual Plant, GeneMANIA
Frozen in the Ice: Exploring the Arctic
Why would hundreds of scientists from around the world intentionally freeze a ship in Arctic sea ice for an entire year, braving subzero temperatures and months of polar darkness? This may sound like a fictional adventure movie plot, but from September 2019 through October 2020, the MOSAiC (Multidisciplinary drifting Observatory for the Study of Arctic Climate) Arctic research expedition did just this.
In this course, you’ll hear directly from MOSAiC scientists and Arctic experts as they describe why this expedition is so key for increasing our understanding of the Arctic and global climate systems and what kinds of data they will be collecting during MOSAiC on the ice, under the sea, and in the air. The course kicks off with content around Arctic geography, climate, and exploration history, and then walks learners through the basics of the components of the Arctic system: atmosphere, ocean, sea ice and ecosystems. You will also learn how the data collected during MOSAiC will be used to improve climate model projections. Finally, we will wrap up the course by exploring challenges the new Arctic faces, including how indigenous peoples in the Arctic are being impacted in different ways by a changing Arctic environment.
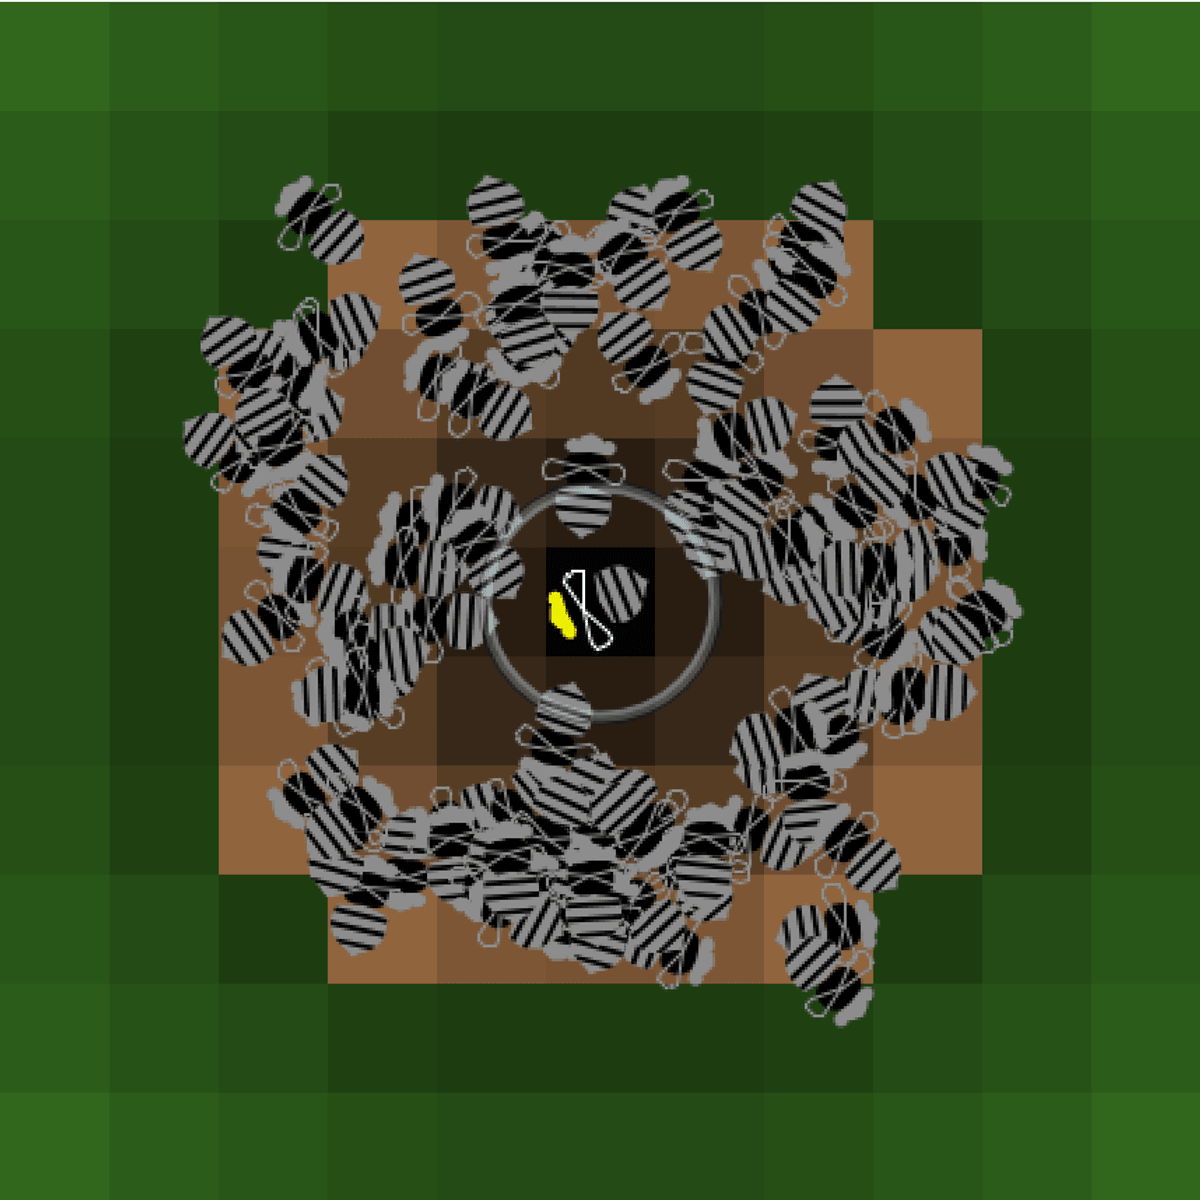
Participatory NetLogo Simulations with HubNet
In this guided project you will learn how to use the HubNet technology from the NetLogo modelling environment. HubNet makes it possible to create participatory simulations where users can interact simultaneously in the same simulation using networked computers. By doing so, they are able to collectively enact the behavior of a system.
You will learn how to use HubNet in the context of the BeeSmart Hive Finding model, which has been created from the observations described in the book HoneyBee Democracy. Finally, you will be shown the first steps to design your own custom HubNet activities, modeled after phenomena you find relevant.
Advanced Reproducibility in Cancer Informatics
This course introduces tools that help enhance reproducibility and replicability in the context of cancer informatics. It uses hands-on exercises to demonstrate in practical terms how to get acquainted with these tools but is by no means meant to be a comprehensive dive into these tools. The course introduces tools and their concepts such as git and GitHub, code review, Docker, and GitHub actions.
Target Audience
The course is intended for students in the biomedical sciences and researchers who use informatics tools in their research. It is the follow up course to the Introduction to Reproducibility in Cancer Informatics course. Learners who take this course should:
- Have some familiarity with R or Python
- Have take the Introductory Reproducibility in Cancer Informatics course
- Have some familiarity with GitHub
Motivation
Data analyses are generally not reproducible without direct contact with the original researchers and a substantial amount of time and effort (BeaulieuJones, 2017). Reproducibility in cancer informatics (as with other fields) is still not monitored or incentivized despite that it is fundamental to the scientific method. Despite the lack of incentive, many researchers strive for reproducibility in their own work but often lack the skills or training to do so effectively.
Equipping researchers with the skills to create reproducible data analyses increases the efficiency of everyone involved. Reproducible analyses are more likely to be understood, applied, and replicated by others. This helps expedite the scientific process by helping researchers avoid false positive dead ends. Open source clarity in reproducible methods also saves researchers' time so they don't have to reinvent the proverbial wheel for methods that everyone in the field is already performing.
Curriculum
The course includes hands-on exercises for how to apply reproducible code concepts to their code. Individuals who take this course are encouraged to complete these activities as they follow along with the course material to help increase the reproducibility of their analyses.
**Goal of this course:**
To equip learners with a deeper knowledge of the capabilities of reproducibility tools and how they can apply to their existing analyses scripts and projects.
**What is NOT the goal of this course:**
To be a comprehensive dive into each of the tools discussed. .
How to use the course
Each chapter has associated exercises that you are encourage to complete in order to get the full benefit of the course
This course is designed with busy professional learners in mind -- who may have to pick up and put down the course when their schedule allows. In general, you are able to skip to chapters you find a most useful to (One incidence where a prior chapter is required is noted).
Each chapter has associated exercises that you are encourage to complete in order to get the full benefit of the course
Excel/VBA for Creative Problem Solving, Part 1
"Excel/VBA for Creative Problem Solving, Part 1" is aimed at learners who are seeking to augment, expand, optimize, and increase the efficiency of their Excel spreadsheet skills by tapping into the powerful programming, automation, and customization capabilities available with Visual Basic for Applications (VBA).
This course is the first part of a three-part series and Specialization that focuses on the application of computing techniques in Excel/VBA to solve problems. In this course (Part 1), you will: 1) create macros to automate procedures in Excel; 2) define your own user-defined functions; 3) create basic subroutines to interface with the user; 4) learn the basic programming structures in VBA; and 5) automate Excel’s Goal Seek and Solver tools and use numerical techniques to create “live solutions” to solve targeting and optimization problems.
New to computer programming? The extremely intuitive and visual nature of VBA lends itself nicely to teaching and learning - what a fun way to learn to code! No prior knowledge in programming nor advanced math skills are necessary yet seasoned programmers will pick up new and creative spreadsheet problem solving strategies.
After you have learned the basics of VBA, each module will introduce foundational and broad problems inspired by situations that you might encounter in the real world. To pass each module, you'll need to pass a mastery quiz and complete a problem solving assignment. This course is unique in that the weekly assignments are completed in-application (i.e., on your own computer in Excel), providing you with valuable hands-on training.
Popular Internships and Jobs by Categories
Find Jobs & Internships
Browse


© 2024 BoostGrad | All rights reserved