Back to Courses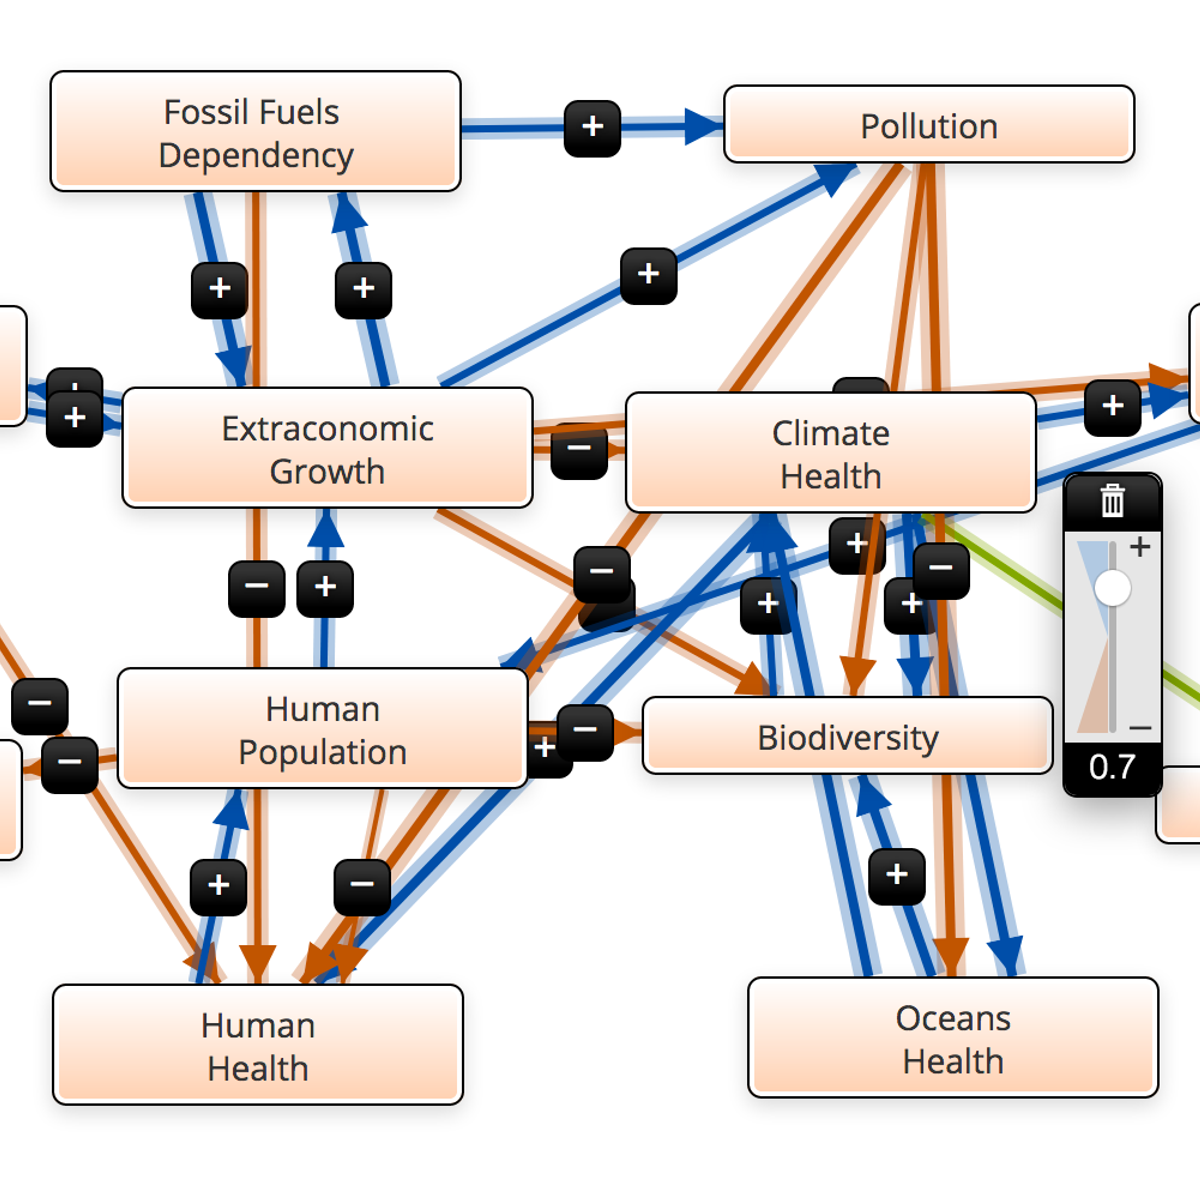



Research Methods Courses
Showing results 1-10 of 48

Human Predicament Complex Modeling
The convergence of different crises pressuring the world today is probably one of the most complex human-made phenomena we can observe. From biodiversity loss to the threat to democracy, all of these crises are deeply intertwined. Therefore, tools from the complexity and systems-thinking toolsets become very relevant for anyone seeking to have a slight grasp of what is going on and what is probably going to happen. This project is about using two of these tools to have a minimal understanding of how all of these crises are interconnected and to simulate possible future scenarios.
The aforementioned tools are Loopy and Mental Modeler, which combine provide a insightful framework for the study of the current Human Predicament and other highly complex situations. Moreover, in this project you will have the opportunity to participate in an experiment that tries to touch on the collective intelligence permeating us all in order to have a better understanding of our current situation - and maybe find more suitable paths. Are you ready?
Note: This project works best for learners who are based in the North America region. We’re currently working on providing the same experience in other regions.

(Non) Status quo Attitudes with NetLogo
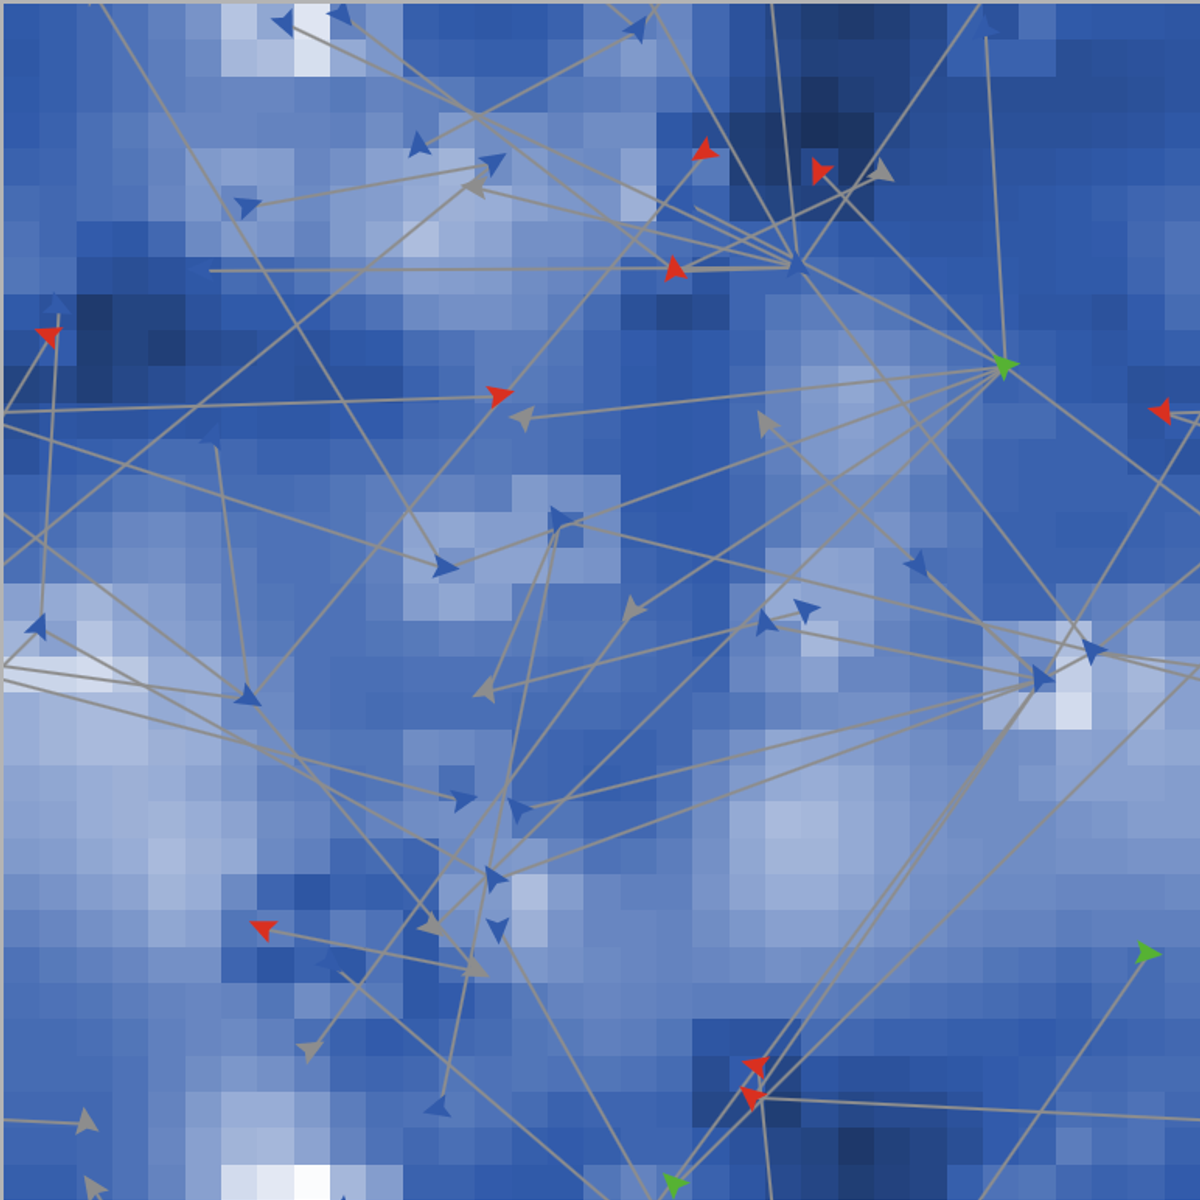
Have you ever wondered what is behind different cultural traits and attitudes towards the status quo? Or more broadly, what influences the Zeitgeist of a society? Generally speaking, when it comes to changing (or not) the current spirit and state of affairs of a given society or community, some people show themselves as idealists, and they can even inspire others. At the same time, some other people are traditionalists, and some are just neutral about how things are. In this guided-project you will develop an agent-based model using NetLogo that tries to use these personas to touch and generate insights around theses questions. And while doing so, you will gain some hands-on knowledge on model building and debugging.
Note: This project works best for learners who are based in the North America region. We’re currently working on providing the same experience in other regions.

Storytelling with Kumu
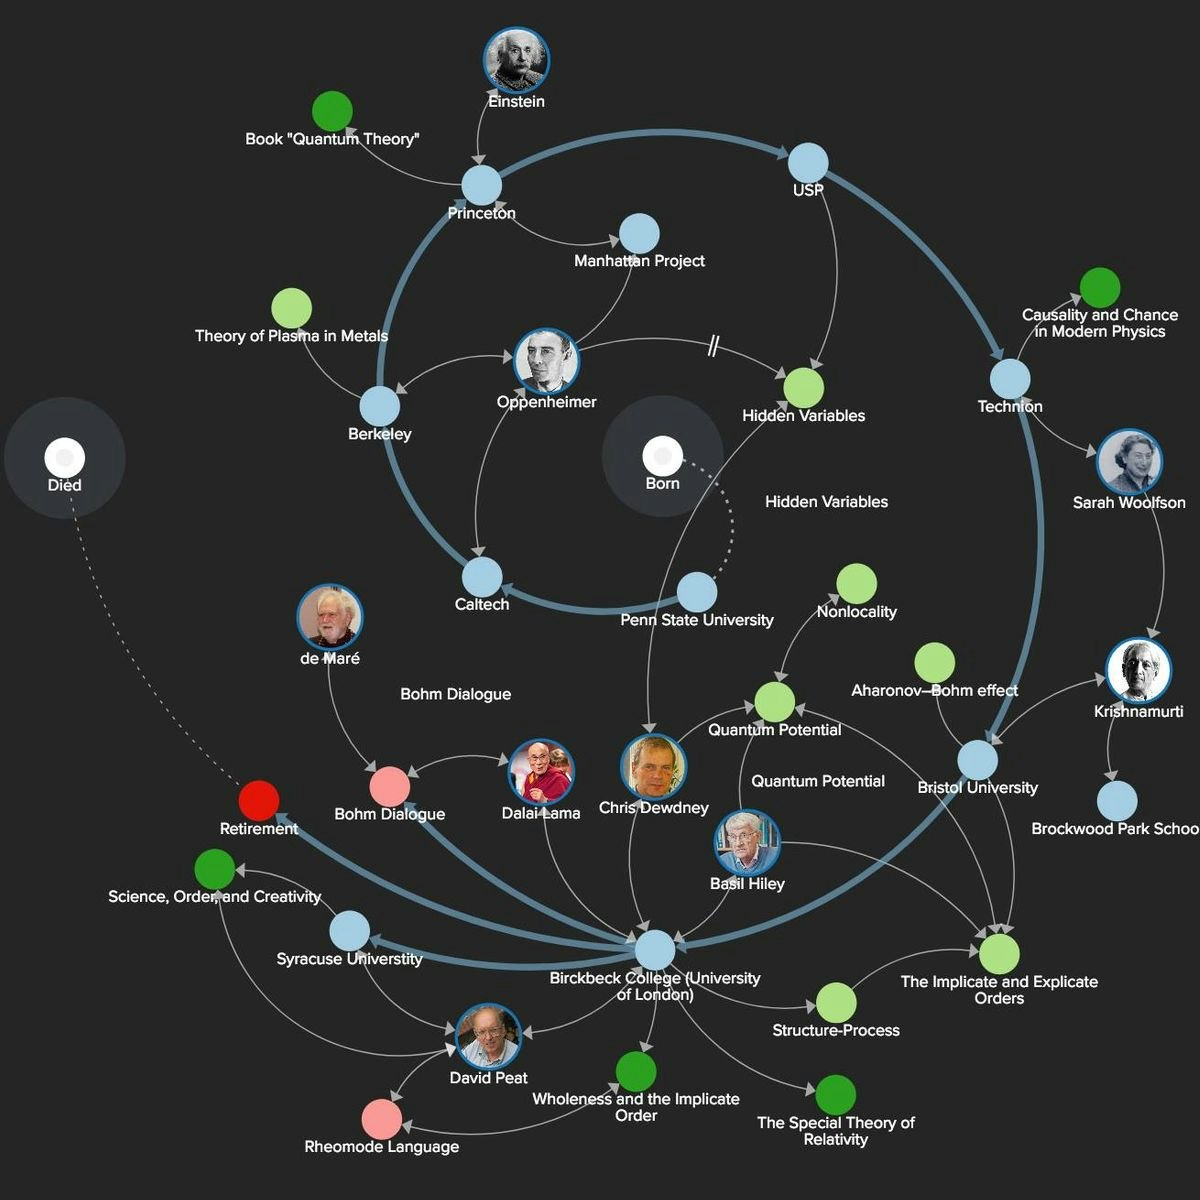
In this project-based course, you will use Kumu to create a relationship map about the life & ideas of physicist and philosopher David Bohm, inspired by the documentary Infinite Potential. By doing so, you will implement advanced functionalities using Kumu's Advanced Editor; and create an interactive presentation based on your map to tell Bohm's story.
This project brings the features and capabilities of Kumu to another realm, where maps that are usually used to represent systems and networks become visual scaffoldings for different ways to tell a story.
Note: This course works best for learners who are based in the North America region. We’re currently working on providing the same experience in other regions.

Being a researcher (in Information Science and Technology)
The course provides a broad view of how to become and progress as a researcher. It spans over a wide range of topics, from the historical development of scientific thought to research methodology, to the pragmatics of publication, research funding, evaluation, and promotion in a researcher’s career. It also stresses the ethical aspects of research. Although the course speaks about scientific research in general, it especially focuses on the field on Information and Communication Science and Technology.
The course is mainly directed to students engaging in research and beginning researchers. It may also be of interest for senior researcher in their role as supervisors or mentors, and to all those who are interested in how scientific research works. The main topics addressed in the course are:
- Research, its historical development, and its role in society;
- Research methodology;
- The products of research: publications and artifacts;
- The professional researcher: roles and career progress;
- Research evaluation, from peer review to bibliometrics;
- Research ethics.

Hardware Security
In this course, we will study security and trust from the hardware perspective. Upon completing the course, students will understand the vulnerabilities in current digital system design flow and the physical attacks to these systems. They will learn that security starts from hardware design and be familiar with the tools and skills to build secure and trusted hardware.
3D Data Visualization for Science Communication
This course is an introduction to 3D scientific data visualization, with an emphasis on science communication and cinematic design for appealing to broad audiences. You will develop visualization literacy, through being able to interpret/analyze (read) visualizations and create (write) your own visualizations.
By the end of this course, you will:
-Develop visualization literacy.
-Learn the practicality of working with spatial data.
-Understand what makes a scientific visualization meaningful.
-Learn how to create educational visualizations that maintain scientific accuracy.
-Understand what makes a scientific visualization cinematic.
-Learn how to create visualizations that appeal to broad audiences.
-Learn how to work with image-making software. (for those completing the Honors track)

Building an Ecosystem model with Insight Maker
In this 1-hour long project-based course, you will create a model that simulates the interrelated dynamics of three different species populations within an environment: plants, deer, and wolves
By doing so, you’ll be introduced to Insight Maker, a free web-based simulation environment that supports both System Dynamics modeling and Agent Based modeling. This will equip you with everything you need to know in order to build tailor-made models and simulations.
Note: This course works best for learners who are based in the North America region. We’re currently working on providing the same experience in other regions.

Introducing Cellular Automata
In this hands-on guided project you will be introduced to the wonders of Cellular Automata, a powerful modeling framework for the exploration of inter-scale dynamics. That is, how do simple local level rules give rise to global pattern formation and self-organization?
You will explore questions like this with the help of Golly and NetLogo, two rich simulations softwares for the creation of CA and agent-based models. Moreover, you will be exposed to cutting edge applications of Cellular Automata in the fields of Biology (Morphogenesis) and Physics.

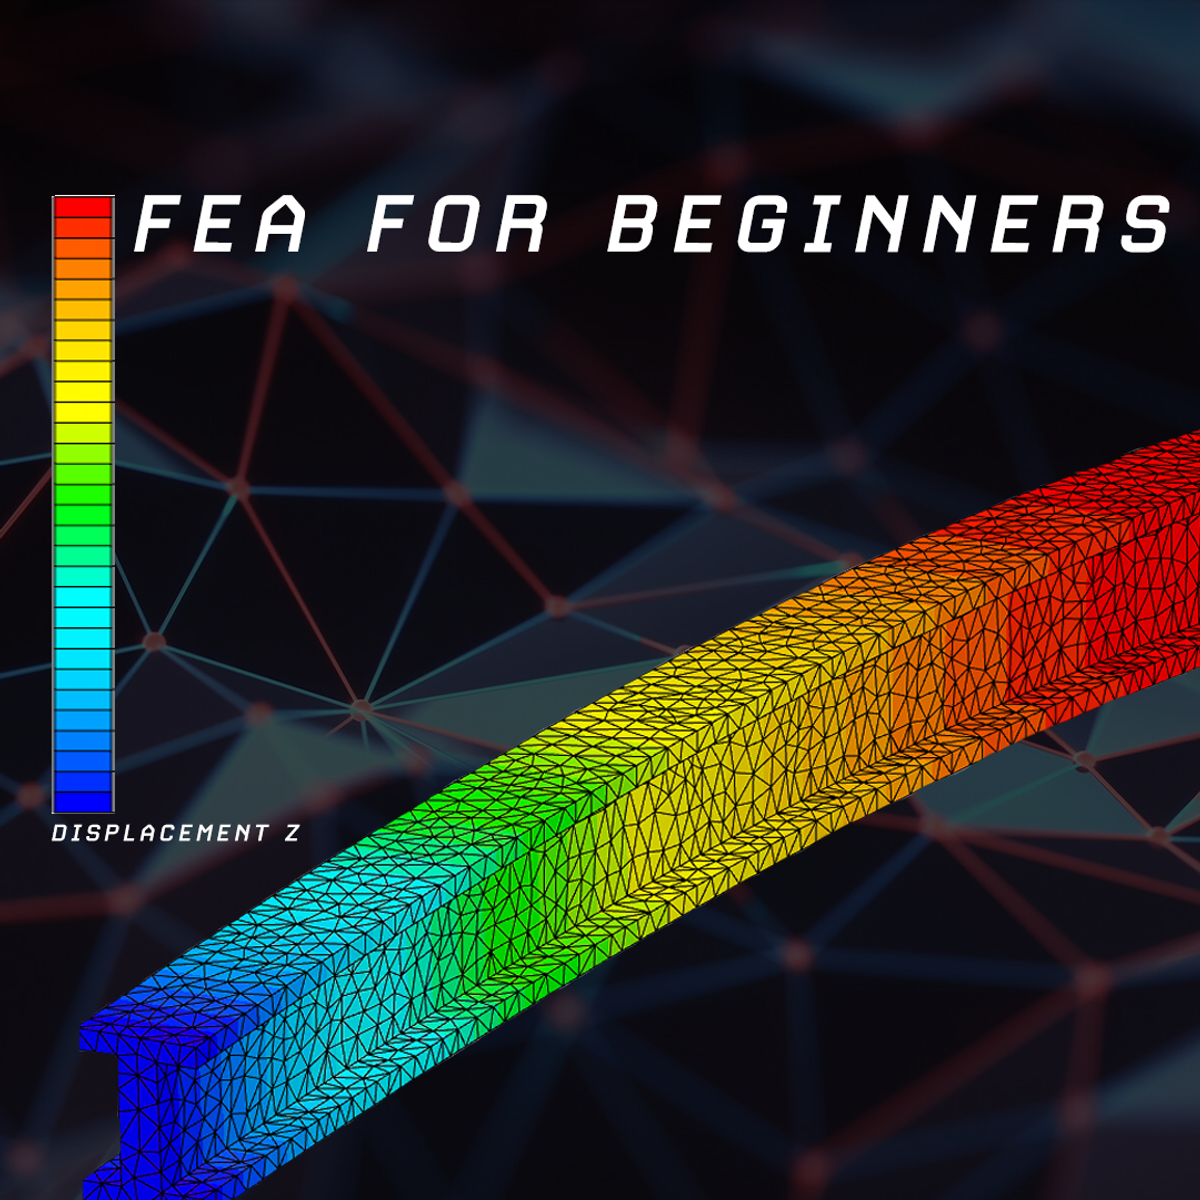
SimScale for Engineering Simulations - FEA for Beginners
In this hands-on project, you will learn about the Finite Element Method (FEM) and validate a simulation case using the cloud-based simulation tool SimScale. We will set up a simple simulation case with a provided geometry to learn the fundamentals of the Finite Element Method and how a validation case is approached in the first place. We will walk through the classical three step process of every simulation which includes the pre-processing, processing and post-processing step.
SimScale is an engineering simulation platform that is revolutionizing the way engineers, designers, scientists, and students design products. The SimScale platform is accessible completely via a standard web browser, with an easy-to-use interface which supports numerous simulation types including solid mechanics (FEM), fluid dynamics (CFD) & thermodynamics.
This course runs on Coursera's hands-on project platform called Rhyme. On Rhyme, you do projects in a hands-on manner in your browser. You will get instant access to pre-configured cloud desktops containing all of the software and data you need for the project, for this project you need no special setup or any data. Everything is already set up directly in your internet browser so you can just focus on learning!
Notes:
- This course works best for learners who are based in the North America region. We’re currently working on providing the same experience in other regions.

How to Visualize Research Data in Tableau
Publishing research often requires the preparation of visual elements like charts, tables, and graphs to better explain the text in a research report. Creating these elements can be done easily and effectively in Tableau. Using Tableau, large and small data sets can be visualized with precision, creativity, interactivity, and options in Tableau. After taking this course learners will know how to create a table, a geovisualization, and a pie chart. Three of the most common research visualizations available. The learners will also learn how to upload data, how to export these tables, and how to incorporate charts and graphs in research reports.
Researchers from students to professionals will benefit from learning how to create visualizations based on surveys, observations, experiments, and other types of research methods.
Knowledge of research is useful but not required for this project.
Popular Internships and Jobs by Categories
Find Jobs & Internships
Browse
© 2024 BoostGrad | All rights reserved