Back to Courses




Data Analysis Courses - Page 83
Showing results 821-830 of 998

Customer Segmentation using K-Means Clustering in R
Welcome to this project-based course, Customer Segmentation using K-Means Clustering in R. In this project, you will learn how to perform customer market segmentation on mall customers data using different R packages.
By the end of this 2-and-a-half-hour long project, you will understand how to get the mall customers data into your RStudio workspace and explore the data. By extension, you will learn how to use the ggplot2 package to render beautiful plots of the data. Also, you will learn how to get the optimal number of clusters for the customers' segments and use K-Means to create distinct groups of customers based on their characteristics. Finally, you will learn how to use the R markdown file to organise your work and how to knit your code into an HTML document for publishing.
Although you do not need to be a data analyst expert or data scientist to succeed in this guided project, it requires a basic knowledge of using R, especially writing R syntaxes. Therefore, to complete this project, you must have prior experience with using R. If you are not familiar with working with using R, please go ahead to complete my previous project titled: “Getting Started with R”. It will hand you the needed knowledge to go ahead with this project on Customer Segmentation. However, if you are comfortable with working with R, please join me on this beautiful ride! Let’s get our hands dirty!

Data Science Capstone
The capstone project class will allow students to create a usable/public data product that can be used to show your skills to potential employers. Projects will be drawn from real-world problems and will be conducted with industry, government, and academic partners.

Practical Python for AI Coding 1
Introduction video: https://youtu.be/TRhwIHvehR0
This course is for a complete novice of Python coding, so no prior knowledge or experience in software coding is required. This course selects, introduces, and explains Python syntaxes, functions, and libraries that were frequently used in AI coding. In addition, this course introduces vital syntaxes, and functions often used in AI coding and explains the complementary relationship among NumPy, Pandas, and TensorFlow, so this course is helpful for even seasoned python users. This course starts with building an AI coding environment without failures on learners’ desktop or notebook computers to enable them to start AI modeling and coding with Scikit-learn, TensorFlow, and Keras upon completing this course. Because learners have an AI coding environment on their computers after taking this course, they can start AI coding and do not need to join or use the cloud-based services.

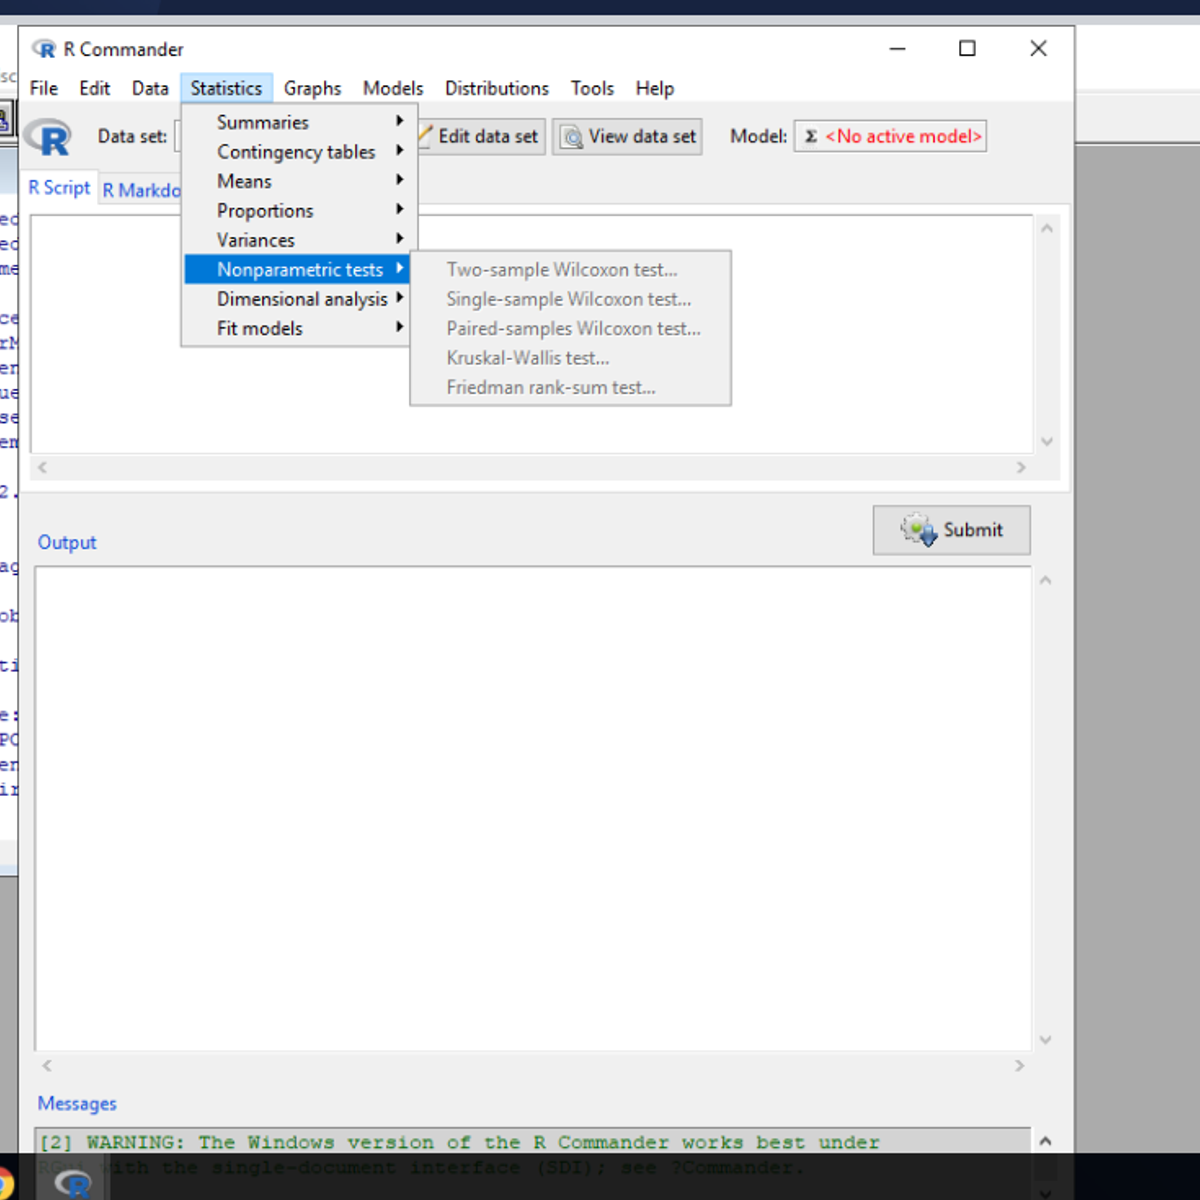
Non parametric Tests using R Cmdr
In this project , you will learn how to conduct non parametric tests using Rcmdr. Non parametric tests are powerful tests which are conducted when underlying assumptions are not met in the data . After completing the project, you will be able to apply the appropriate test for the right data set. You will also learn how to do it in an easy to use Rcmdr.

Applied Plotting, Charting & Data Representation in Python
This course will introduce the learner to information visualization basics, with a focus on reporting and charting using the matplotlib library. The course will start with a design and information literacy perspective, touching on what makes a good and bad visualization, and what statistical measures translate into in terms of visualizations. The second week will focus on the technology used to make visualizations in python, matplotlib, and introduce users to best practices when creating basic charts and how to realize design decisions in the framework. The third week will be a tutorial of functionality available in matplotlib, and demonstrate a variety of basic statistical charts helping learners to identify when a particular method is good for a particular problem. The course will end with a discussion of other forms of structuring and visualizing data.
This course should be taken after Introduction to Data Science in Python and before the remainder of the Applied Data Science with Python courses: Applied Machine Learning in Python, Applied Text Mining in Python, and Applied Social Network Analysis in Python.

Effectively Dealing with Imbalance Classes
In this 2 hour guided project you will learn how to deal with imbalance classification problems in a profound manner, applying several resampling strategies and visualizing the effects of resampling on imbalance classification dataset.
Note: This project works best for learners who are based in the North America region. We’re currently working on providing the same experience in other regions.

Real-time data visualization dashboard using Node-red
At the end of this project you are going learn how to create an real-time data visualization dashboard using node-red. so in this project we are going to use openAQ API which is an open source API sharing real-time air quality data related to different cities around the globe. we are going to fetch this
data, preprocess it and visualize it using node-red. Therefor, as a very important prerequisite you should have a basic knowledge of node-red. if you don’t have any experience using node-red I recommend to attend my guided project course on introduction to node-red on Coursera.

Twitter API: Mining Data using Orange Data Mining Platform
In this one hour long project, you will mine, analyze and visualize various trending tweets using Word Cloud, Heat map, Document Map and perform sentiment analysis using Orange. Orange is an open-source data visualization, machine learning and data mining toolkit. Without any prior programming experience, Orange allows you to mine Twitter. If you are a corporate employee, marketer, or even a student who wants to explore how to mine tweets, Orange is the best platform for it.
We will begin this guided project by creating a Twitter developer account and applying for elevated access. We will create an app within the Twitter developer portal and get its API keys and then use these API keys to connect to Orange data mining software. We will fetch tweets about trending topics and create a Word-cloud for text visualization and Documents map to get Geo-location data about trending tweets. In the final tasks, we will perform sentiment analysis and explore the emotions behind each tweet using the Tweet Profiler widget. We will also create a Heat-map to understand the overall sentiment of a trending topic.
In order to complete this project successfully, you need a Twitter account.

Visualizing Data in the Tidyverse
Data visualization is a critical part of any data science project. Once data have been imported and wrangled into place, visualizing your data can help you get a handle on what’s going on in the data set. Similarly, once you’ve completed your analysis and are ready to present your findings, data visualizations are a highly effective way to communicate your results to others. In this course we will cover what data visualization is and define some of the basic types of data visualizations.
In this course you will learn about the ggplot2 R package, a powerful set of tools for making stunning data graphics that has become the industry standard. You will learn about different types of plots, how to construct effect plots, and what makes for a successful or unsuccessful visualization.
In this specialization we assume familiarity with the R programming language. If you are not yet familiar with R, we suggest you first complete R Programming before returning to complete this course.

Migrate for Anthos: Qwik Start
This is a self-paced lab that takes place in the Google Cloud console. In this lab you'll use Migrate for Anthos to migrate a Compute Engine VM instance to a corresonding container image hosted in a Kubernetes pod.
Popular Internships and Jobs by Categories
Browse
© 2024 BoostGrad | All rights reserved


