Back to Courses


Data Analysis Courses - Page 75
Showing results 741-750 of 998

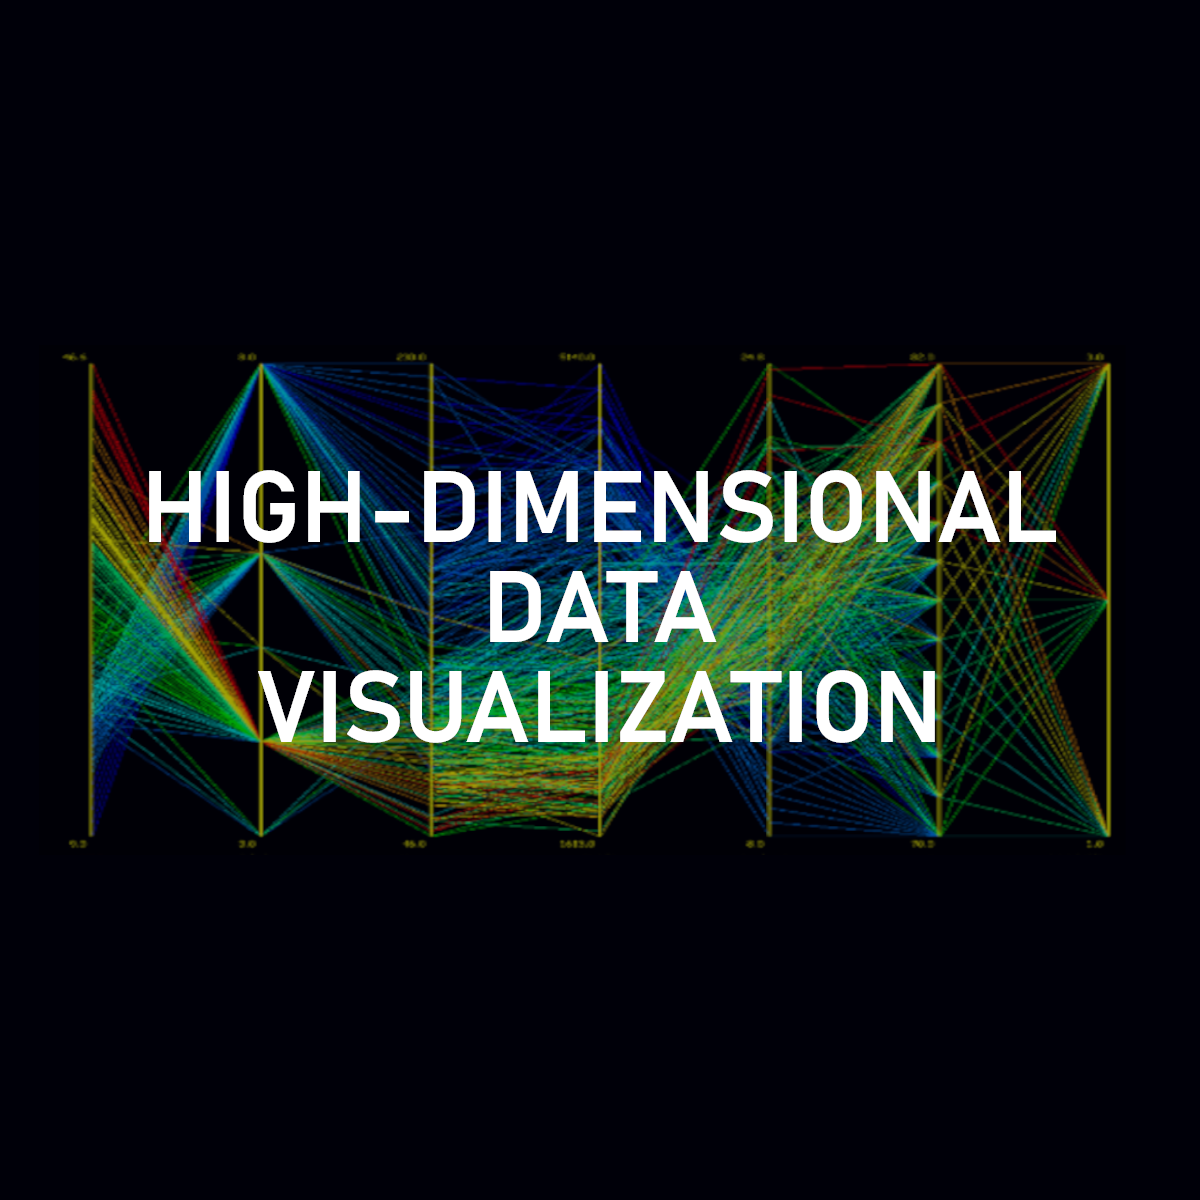
High-dimensional Data visualization techniques using python
By the end of this project you will learn how to analyze high-dimensional data using different visualization techniques. We are going to learn how to implement Scatterplot Matrix and Parallel coordinate plots (PCP) in python. and We will learn how to use these two high-dimensional data visualization techniques to analyze our data by solving three tasks: Outlier Detection, Correlation Analysis and Cluster analysis. we will also talk about Data reduction techniques. we will learn how to sample our data to reduce the number of the data points for a better visualization. We will also learn about the Dimensionality reduction technique to reduce the number of dimensions in our dataset and how it can help us for a better analysis.

Operational Analytics with Microsoft Azure Synapse Analytics
In this course, you will learn how to perform operational analytics against Azure Cosmos DB using the Azure Synapse Link feature within Azure Synapse Analytics.
You will learn how hybrid transactional and analytical processing can help you perform operational analytics with Azure Synapse Analytics. You will also learn how to configure and enable Azure Synapse Link to interact with Azure Cosmos DB and how you can perform analytics against Azure Cosmos DB using Azure Synapse Link.
This course is part of a Specialization intended for Data engineers and developers who want to demonstrate their expertise in designing and implementing data solutions that use Microsoft Azure data services for anyone interested in preparing for the Exam DP-203: Data Engineering on Microsoft Azure (beta). You will take a practice exam that covers key skills measured by the certification exam.
This is the seventh course in a program of 10 courses to help prepare you to take the exam so that you can have expertise in designing and implementing data solutions that use Microsoft Azure data services. The Data Engineering on Microsoft Azure exam is an opportunity to prove knowledge expertise in integrating, transforming, and consolidating data from various structured and unstructured data systems into structures that are suitable for building analytics solutions that use Microsoft Azure data services. Each course teaches you the concepts and skills that are measured by the exam.
By the end of this Specialization, you will be ready to take and sign-up for the Exam DP-203: Data Engineering on Microsoft Azure (beta).

Supply Chain Planning
Supply chain planning is an important activity in any supply chain. This is where organizations get an idea of the upcoming demand, realize if they have the capacity to meet the demand, and determine how to realize these demands. In this course, we will explore how to use data science to conduct demand and supply planning, how to constrain the forecast, and how to measure the results. As we walk through this process, we will also explore how to use Excel to quantify each step.

Enterprise Systems
This course provides you with an understanding of what Enterprise Systems (also commonly termed as Enterprise Resource Planning Systems, ERPs) are. After learning about what these systems are, we would touch upon why these systems are useful to companies, through which you would get to see the various jobs and positions that are associated with the use and deployment of ERPs.
In this course, you would also develop an appreciation of the managerial aspects related to the selection and implementation of ERPs. Specifically, we would touch on the important points to consider when shortlisting and purchasing an ERP, the approaches taken in ERP implementation, and change management techniques to utilize when an organization is undergoing ERP implementation. At the end of this class, you will be endowed with practical knowledge that would help you to address real world business problems associated with ERP usage and implementation.

Custom Reports in Google Analytics
In this project, you will create three custom reports in Google Analytics, using three different methods. You will understand the building blocks of a custom report. You will determine what data is needed for a custom report. And, you will create the custom report to best meet your analysis and monitoring needs. You will also discover the Google Gallery where you can find various types of custom reports, and import the ones that best meet your needs.
Note: This course works best for learners who are based in the North America region. We’re currently working on providing the same experience in other regions.

SQL for Data Science Capstone Project
Data science is a dynamic and growing career field that demands knowledge and skills-based in SQL to be successful. This course is designed to provide you with a solid foundation in applying SQL skills to analyze data and solve real business problems.
Whether you have successfully completed the other courses in the Learn SQL Basics for Data Science Specialization or are taking just this course, this project is your chance to apply the knowledge and skills you have acquired to practice important SQL querying and solve problems with data. You will participate in your own personal or professional journey to create a portfolio-worthy piece from start to finish. You will choose a dataset and develop a project proposal. You will explore your data and perform some initial statistics you have learned through this specialization. You will uncover analytics for qualitative data and consider new metrics that make sense from the patterns that surface in your analysis. You will put all of your work together in the form of a presentation where you will tell the story of your findings. Along the way, you will receive feedback through the peer-review process. This community of fellow learners will provide additional input to help you refine your approach to data analysis with SQL and present your findings to clients and management.

Data Analysis Using Pyspark
One of the important topics that every data analyst should be familiar with is the distributed data processing technologies. As a data analyst, you should be able to apply different queries to your dataset to extract useful information out of it. but what if your data is so big that working with it on your local machine is not easy to be done. That is when the distributed data processing and Spark Technology will become handy. So in this project, we are going to work with pyspark module in python and we are going to use google colab environment in order to apply some queries to the dataset we have related to lastfm website which is an online music service where users can listen to different songs. This dataset is containing two csv files listening.csv and genre.csv. Also, we will learn how we can visualize our query results using matplotlib.

Information Visualization: Programming with D3.js
In this course you will learn how to use D3.js to create powerful visualizations for web. Learning D3.js will enable you to create many different types of visualization and to visualize many different data types. It will give you the freedom to create something as simple as a bar chart as well your own new revolutionary technique.
In this course we will cover the basics of creating visualizations with D3 as well as how to deal with tabular data, geography and networks. By the end of this course you will be able to:
- Create bar and line charts
- Create choropleth and symbol maps
- Create node-link diagrams and tree maps
- Implement zooming and brushing
- Link two or more views through interaction
The course mixes theoretical and practical lectures. We will show you step by step how to use the library to build actual visualizations and what theoretical concepts lie behind them. Throughout the course you will learn skills that will lead you to building a whole application by the end of the lectures (a fully working visualization system to visualize airlines routes).
This course is the third one of the “Specialization in Information Visualization". The course expects you to have some basic knowledge of programming as well as some basic visualization skills.

Unsupervised Text Classification for Marketing Analytics
Marketing data is often so big that humans cannot read or analyze a representative sample of it to understand what insights might lie within. In this course, learners use unsupervised deep learning to train algorithms to extract topics and insights from text data. Learners walk through a conceptual overview of unsupervised machine learning and dive into real-world datasets through instructor-led tutorials in Python. The course concludes with a major project.
This course uses Jupyter Notebooks and the coding environment Google Colab, a browser-based Jupyter notebook environment. Files are stored in Google Drive.
This course can be taken for academic credit as part of CU Boulder’s Master of Science in Data Science (MS-DS) degree offered on the Coursera platform. The MS-DS is an interdisciplinary degree that brings together faculty from CU Boulder’s departments of Applied Mathematics, Computer Science, Information Science, and others. With performance-based admissions and no application process, the MS-DS is ideal for individuals with a broad range of undergraduate education and/or professional experience in computer science, information science, mathematics, and statistics. Learn more about the MS-DS program at https://www.coursera.org/degrees/master-of-science-data-science-boulder.

Introduction to Google SEO
Ever wonder how major search engines such as Google, Bing and Yahoo rank your website within their searches? Or how content such as videos or local listings are shown and ranked based on what the search engine considers most relevant to users? Welcome to the world of Search Engine Optimization (SEO). This course is the first within the SEO Specialization and it is intended to give you a taste of SEO with some fun practices to get seen in Google.
You will be introduced to the foundational elements of how the most popular search engine, Google, works, how the SEO landscape is constantly changing and what you can expect in the future. You discuss core SEO strategies and tactics used to drive more organic search results to a specific website or set of websites, as well as tactics to avoid to prevent penalization from Google. We hope this taste of SEO, will entice you to continue through the Specialization!
Popular Internships and Jobs by Categories
Browse
© 2024 BoostGrad | All rights reserved


