Back to Courses


Data Analysis Courses - Page 22
Showing results 211-220 of 998
Data Processing Using Python
This course (The English copy of "用Python玩转数据" <https://www.coursera.org/learn/hipython/home/welcome>) is mainly for non-computer majors. It starts with the basic syntax of Python, to how to acquire data in Python locally and from network, to how to present data, then to how to conduct basic and advanced statistic analysis and visualization of data, and finally to how to design a simple GUI to present and process data, advancing level by level.
This course, as a whole, based on Finance data and through the establishment of popular cases one after another, enables learners to more vividly feel the simplicity, elegance, and robustness of Python. Also, it discusses the fast, convenient and efficient data processing capacity of Python in humanities and social sciences fields like literature, sociology and journalism and science and engineering fields like mathematics and biology, in addition to business fields. Similarly, it may also be flexibly applied into other fields.
The course has been updated. Updates in the new version are :
1) the whole course has moved from Python 2.x to Python 3.x
2) Added manual webpage fetching and parsing. Web API is also added.
3) Improve the content order and enrich details of some content especially for some practice projects.
Note: videos are in Chinese (Simplified) with English subtitles. All other materials are in English.
Practical SAS Programming and Certification Review
In this course you have the opportunity to use the skills you acquired in the two SAS programming courses to solve realistic problems. This course is also designed to give you a thorough review of SAS programming concepts so you are prepared to take the SAS Certified Specialist: Base Programming Using SAS 9.4 Exam.
Master Data Analysis with Pandas: Learning Path 1 (Enhanced)
In this hands-on guided project, we will master the fundamentals of data analysis and manipulation with Pandas and Python. Pandas is a super powerful, fast, flexible and easy to use open-source data analysis and manipulation tool. This guided project is the first of a series of multiple guided projects (learning path) that is designed for anyone who wants to master data analysis with pandas.
Build Data Analysis tools using R and DPLYR
In this 2-hour long project-based course, you will learn one of the most powerful data analysis tools of the experts: the DPLYR package. By learning the six main verbs of the package (filter, select, group by, summarize, mutate, and arrange), you will have the knowledge and tools to complete your next data analysis project or data transformation.
By the end of this project, you will be able to:
Use the six main dplyr verbs
Understand the dplyr package and its capabilities
Get hands-on practice using R and dplyr functions
This course runs on Coursera's hands-on project platform called Rhyme. On Rhyme, you do projects in a hands-on manner in your browser. You will get instant access to pre-configured cloud desktops containing all of the software and data you need for the project. Everything is already set up directly in your internet browser so you can just focus on learning. For this project, this means instant access to a cloud desktop with R and the appropriate packages installed.
Notes:
- You will be able to access the cloud desktop 5 times. However, you will be able to access instructions videos as many times as you want.
- This course works best for learners who are based in the North America region. We’re currently working on providing the same experience in other regions.
Measuring Disease in Epidemiology
Epidemiological research is ubiquitous. Even if you don’t realise it, you come across epidemiological studies and the impact of their findings every single day. You have probably heard that obesity is increasing in high income countries or that malaria is killing millions of people in low income countries. It is common knowledge that smoking causes cancer and that physical activity is protective against heart disease. These facts may seem obvious today, but it took decades of epidemiological research to produce the necessary evidence. In this course, you will learn the fundamental tools of epidemiology which are essential to conduct such studies, starting with the measures used to describe the frequency of a disease or health-related condition. You will also learn how to quantify the strength of an association and discuss the distinction between association and causation. In the second half of the course, you will use this knowledge to describe different strategies for prevention, identify strengths and weaknesses of diagnostic tests and consider when a screening programme is appropriate.
Regression and Classification
Introduction to Statistical Learning will explore concepts in statistical modeling, such as when to use certain models, how to tune those models, and if other options will provide certain trade-offs. We will cover Regression, Classification, Trees, Resampling, Unsupervised techniques, and much more!
This course can be taken for academic credit as part of CU Boulder’s Master of Science in Data Science (MS-DS) degree offered on the Coursera platform. The MS-DS is an interdisciplinary degree that brings together faculty from CU Boulder’s departments of Applied Mathematics, Computer Science, Information Science, and others. With performance-based admissions and no application process, the MS-DS is ideal for individuals with a broad range of undergraduate education and/or professional experience in computer science, information science, mathematics, and statistics. Learn more about the MS-DS program at https://www.coursera.org/degrees/master-of-science-data-science-boulder.
Photo by Nicholas Cappello on Unsplash
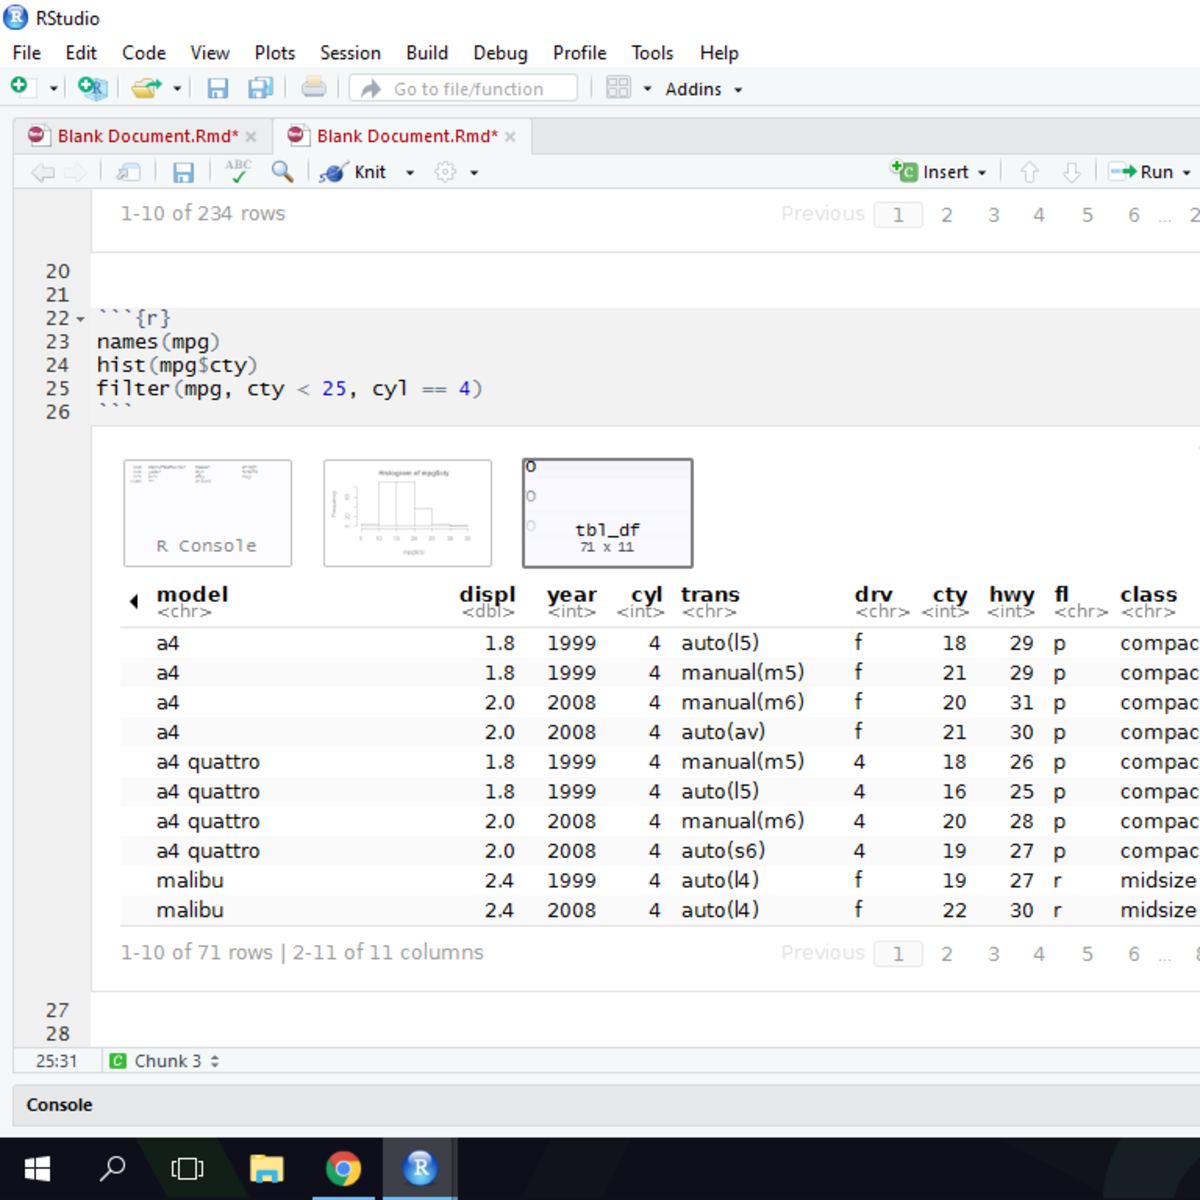
Getting Started with Rstudio
In this 1-hour long project-based course, you will learn everything you need to know to get started with RStudio IDE, including how to install RStudio onto your Windows, MAC or Linux machine, how to use RStudio Cloud, a lightweight, cloud-based version of RStudio, how to start creating R projects, install and load R packages, as well as display interactive maps, graphs and tables with 1 line of code.
This course is perfect if you want to start learning R programming with RStudio: the Premiere IDE for R
Note: This course works best for learners who are based in the North America region. We’re currently working on providing the same experience in other regions.
How to Visualize Research Data in Tableau
Publishing research often requires the preparation of visual elements like charts, tables, and graphs to better explain the text in a research report. Creating these elements can be done easily and effectively in Tableau. Using Tableau, large and small data sets can be visualized with precision, creativity, interactivity, and options in Tableau. After taking this course learners will know how to create a table, a geovisualization, and a pie chart. Three of the most common research visualizations available. The learners will also learn how to upload data, how to export these tables, and how to incorporate charts and graphs in research reports.
Researchers from students to professionals will benefit from learning how to create visualizations based on surveys, observations, experiments, and other types of research methods.
Knowledge of research is useful but not required for this project.
Generate a Report with LibreOffice Base
By the end of this project you will have used LibreOffice to create a variety of reports for displaying data that originates in relational tables. A report provides a way for users to view only the data they need, and in the format that makes data analysis most effective.
Note: This course works best for learners who are based in the North America region. We’re currently working on providing the same experience in other regions.
Linear Regression for Business Statistics
Regression Analysis is perhaps the single most important Business Statistics tool used in the industry. Regression is the engine behind a multitude of data analytics applications used for many forms of forecasting and prediction.
This is the fourth course in the specialization, "Business Statistics and Analysis". The course introduces you to the very important tool known as Linear Regression. You will learn to apply various procedures such as dummy variable regressions, transforming variables, and interaction effects. All these are introduced and explained using easy to understand examples in Microsoft Excel.
The focus of the course is on understanding and application, rather than detailed mathematical derivations.
Note: This course uses the ‘Data Analysis’ tool box which is standard with the Windows version of Microsoft Excel. It is also standard with the 2016 or later Mac version of Excel. However, it is not standard with earlier versions of Excel for Mac.
WEEK 1
Module 1: Regression Analysis: An Introduction
In this module you will get introduced to the Linear Regression Model. We will build a regression model and estimate it using Excel. We will use the estimated model to infer relationships between various variables and use the model to make predictions. The module also introduces the notion of errors, residuals and R-square in a regression model.
Topics covered include:
• Introducing the Linear Regression
• Building a Regression Model and estimating it using Excel
• Making inferences using the estimated model
• Using the Regression model to make predictions
• Errors, Residuals and R-square
WEEK 2
Module 2: Regression Analysis: Hypothesis Testing and Goodness of Fit
This module presents different hypothesis tests you could do using the Regression output. These tests are an important part of inference and the module introduces them using Excel based examples. The p-values are introduced along with goodness of fit measures R-square and the adjusted R-square. Towards the end of module we introduce the ‘Dummy variable regression’ which is used to incorporate categorical variables in a regression.
Topics covered include:
• Hypothesis testing in a Linear Regression
• ‘Goodness of Fit’ measures (R-square, adjusted R-square)
• Dummy variable Regression (using Categorical variables in a Regression)
WEEK 3
Module 3: Regression Analysis: Dummy Variables, Multicollinearity
This module continues with the application of Dummy variable Regression. You get to understand the interpretation of Regression output in the presence of categorical variables. Examples are worked out to re-inforce various concepts introduced. The module also explains what is Multicollinearity and how to deal with it.
Topics covered include:
• Dummy variable Regression (using Categorical variables in a Regression)
• Interpretation of coefficients and p-values in the presence of Dummy variables
• Multicollinearity in Regression Models
WEEK 4
Module 4: Regression Analysis: Various Extensions
The module extends your understanding of the Linear Regression, introducing techniques such as mean-centering of variables and building confidence bounds for predictions using the Regression model. A powerful regression extension known as ‘Interaction variables’ is introduced and explained using examples. We also study the transformation of variables in a regression and in that context introduce the log-log and the semi-log regression models.
Topics covered include:
• Mean centering of variables in a Regression model
• Building confidence bounds for predictions using a Regression model
• Interaction effects in a Regression
• Transformation of variables
• The log-log and semi-log regression models
Popular Internships and Jobs by Categories
Find Jobs & Internships
Browse


© 2024 BoostGrad | All rights reserved