Back to Courses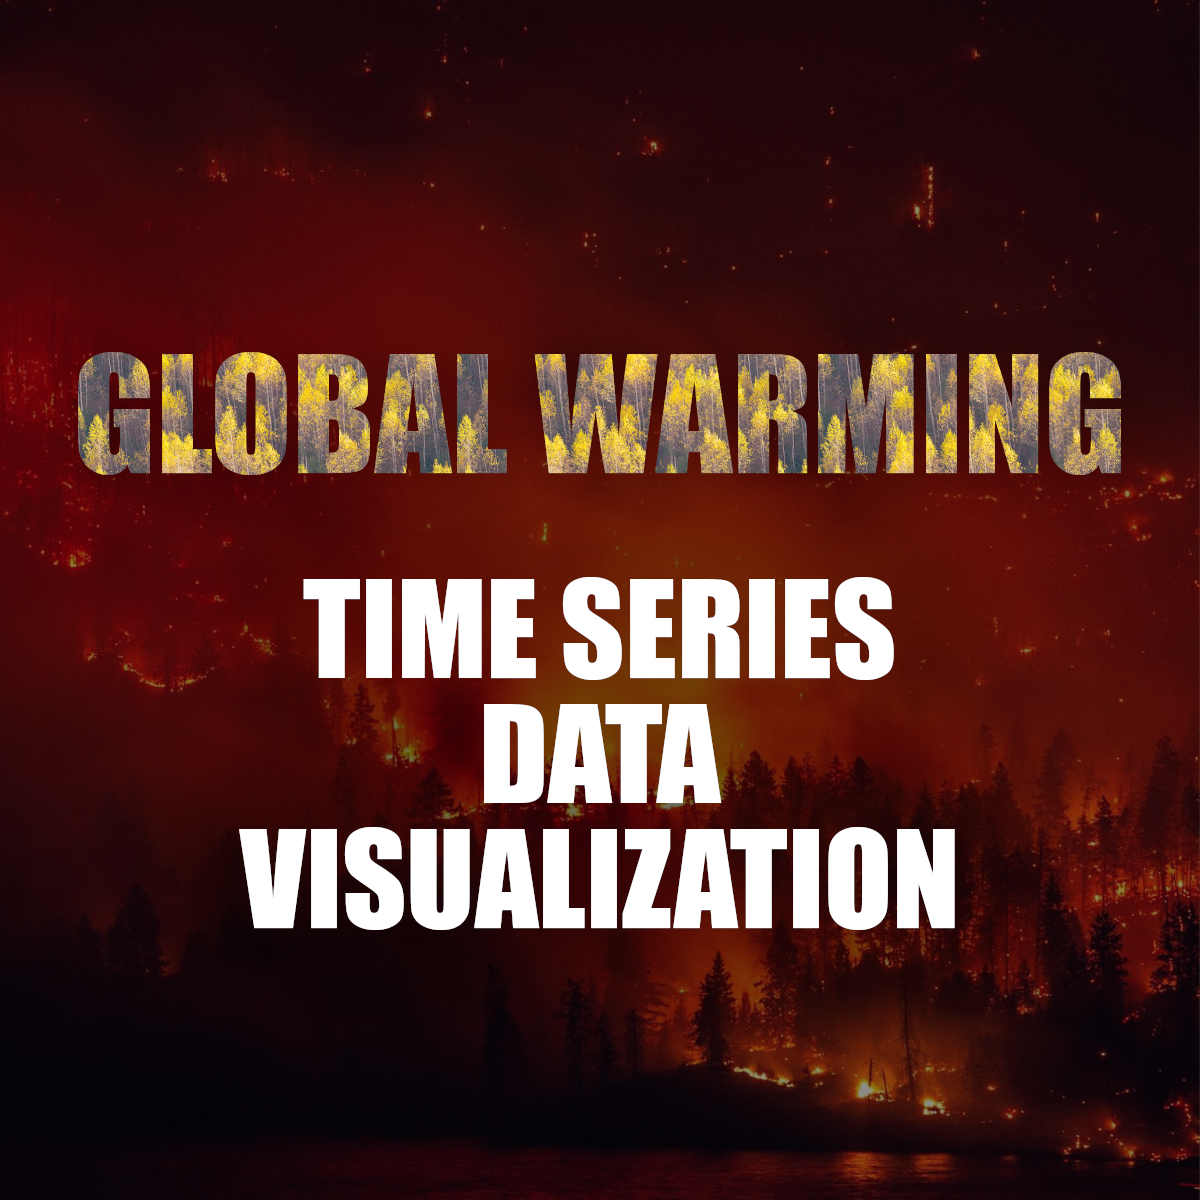


Data Analysis Courses - Page 19
Showing results 181-190 of 998
Time Series Data Visualization And Analysis Techniques
By the end of this project we will learn how to analyze time series data. We are going to talk about different visualization techniques for time series datasets and we are going to compare them in terms of the tasks that we can solve using each of them. Tasks such as outlier detection, Key moments detection and overall trend analysis. During this project, we will learn how and when to use Line charts, Bar charts, and Boxplot. We will also learn some techniques about color mapping and we will understand how it can help us for a better analysis and understanding of our data.
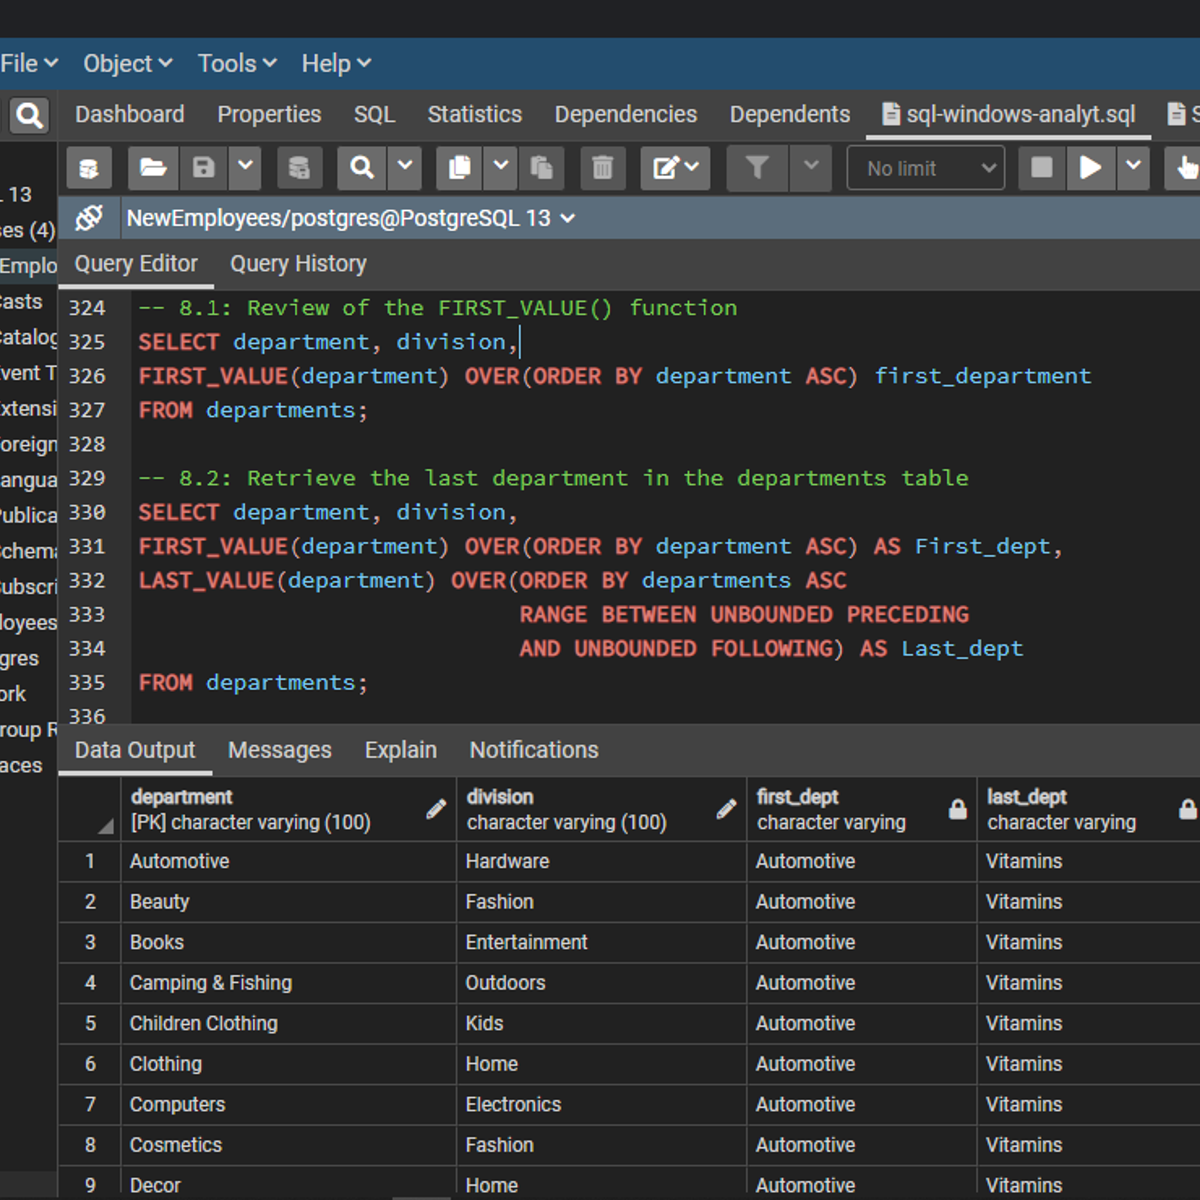
SQL Window Functions for Analytics
Welcome to this project-based course SQL Window Functions for Analytics. This is a hands-on project that will help SQL users use window functions extensively for database insights. In this project, you will learn how to explore and query the project-db database extensively. We will start this hands-on project by retrieving the data in the table in the database.
By the end of this 2-hour-and-a-half-long project, you will be able to use different window functions to retrieve the desired result from a database. In this project, you will learn how to use SQL window functions like ROW_NUMBER(), RANK(), DENSE_RANK(), NTILE(), and LAST_VALUE() to manipulate data in the project-db database. Also, we will consider how to use aggregate window functions. These window functions will be used together with the OVER() clause to query this database. By extension, we will use grouping functions like GROUPING SETS(), ROLLUP(), and CUBE() to retrieve sublevel and grand totals.
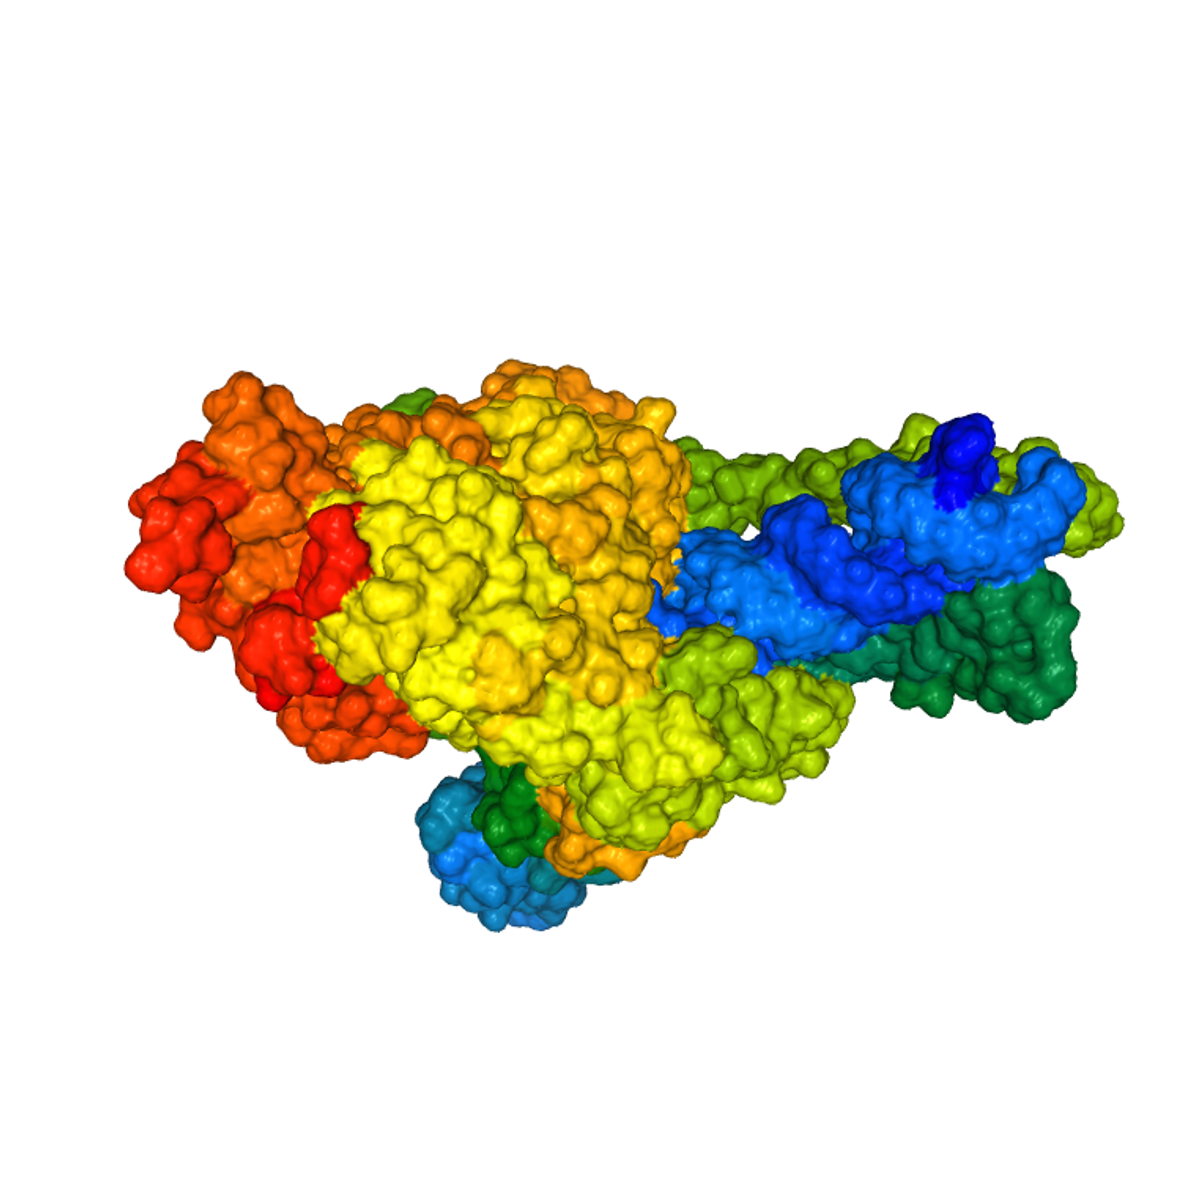
3D SARS-CoV-19 Protein Visualization With Biopython
In this project you will create an interactive three-dimensional (3D) representation of SARS-CoV-19 (Coronavirus) protein structures & publication-quality pictures of the same, understand properties of SARS-CoV-19 genome, handle biological sequence data stored in FASTA & PDB (Protein Data Bank) and XML format, and get insights from this data using Biopython. This hands-on project will also give you a glimpse of tasks a Bioinformatician performs on a daily basis, along with the up-to-date concepts and database use cases in the field of Medical Research and Human genetics.
In this project, we will also cover basics about important databases used by biologists and biotechnologists, along with the type of sequence data we can access and visualize from these databases using Biopython & Jupyter notebook.
Global Statistics - Composite Indices for International Comparisons
The number of composite indices that are constructed and used internationally is growing very fast; but whilst the complexity of quantitative techniques has increased dramatically, the education and training in this area has been dragging and lagging behind. As a consequence, these simple numbers, expected to synthesize quite complex issues, are often presented to the public and used in the political debate without proper emphasis on their intrinsic limitations and correct interpretations.
In this course on global statistics, offered by the University of Geneva jointly with the ETH Zürich KOF, you will learn the general approach of constructing composite indices and some of resulting problems. We will discuss the technical properties, the internal structure (like aggregation, weighting, stability of time series), the primary data used and the variable selection methods. These concepts will be illustrated using a sample of the most popular composite indices. We will try to address not only statistical questions but also focus on the distinction between policy-, media- and paradigm-driven indicators.
Joining Data in R using dplyr
You will need to join or merge two or more data sets at different points in your work as a data enthusiast. The dplyr package offers very sophisticated functions to help you achieve the join operation you desire. This project-based course, "Joining Data in R using dplyr" is for R users willing to advance their knowledge and skills.
In this course, you will learn practical ways for data manipulation in R. We will talk about different join operations and spend a great deal of our time here joining the sales and customers data sets using the dplyr package. By the end of this 2-hour-long project, you will perform inner join, full (outer) join, right join, left join, cross join, semi join, and anti join using the merge() and dplyr functions.
This project-based course is an intermediate-level course in R. Therefore, to get the most of this project, it is essential to have prior experience using R for basic analysis. I recommend that you complete the project titled: "Data Manipulation with dplyr in R" before you take this current project.
Mastering Data Analysis with Pandas: Learning Path Part 3
In this structured series of hands-on guided projects, we will master the fundamentals of data analysis and manipulation with Pandas and Python. Pandas is a super powerful, fast, flexible and easy to use open-source data analysis and manipulation tool. This guided project is the third of a series of multiple guided projects (learning path) that is designed for anyone who wants to master data analysis with pandas.
Note: This course works best for learners who are based in the North America region. We’re currently working on providing the same experience in other regions.
Python for Data Visualization: Matplotlib & Seaborn
In this hands-on project, we will understand the fundamentals of data visualization with Python and leverage the power of two important python libraries known as Matplotlib and seaborn. We will learn how to generate line plots, scatterplots, histograms, distribution plot, 3D plots, pie charts, pair plots, countplots and many more!
Note: This course works best for learners who are based in the North America region. We’re currently working on providing the same experience in other regions.
Scikit-Learn For Machine Learning Classification Problems
Hello everyone and welcome to this new hands-on project on Scikit-Learn Library for solving machine learning classification problems. In this project, we will learn how to build and train classifier models using Scikit-Learn library. Scikit-learn is a free machine learning library developed for python. Scikit-learn offers several algorithms for classification, regression, and clustering. Several famous machine learning models are included such as support vector machines, random forests, gradient boosting, and k-means.
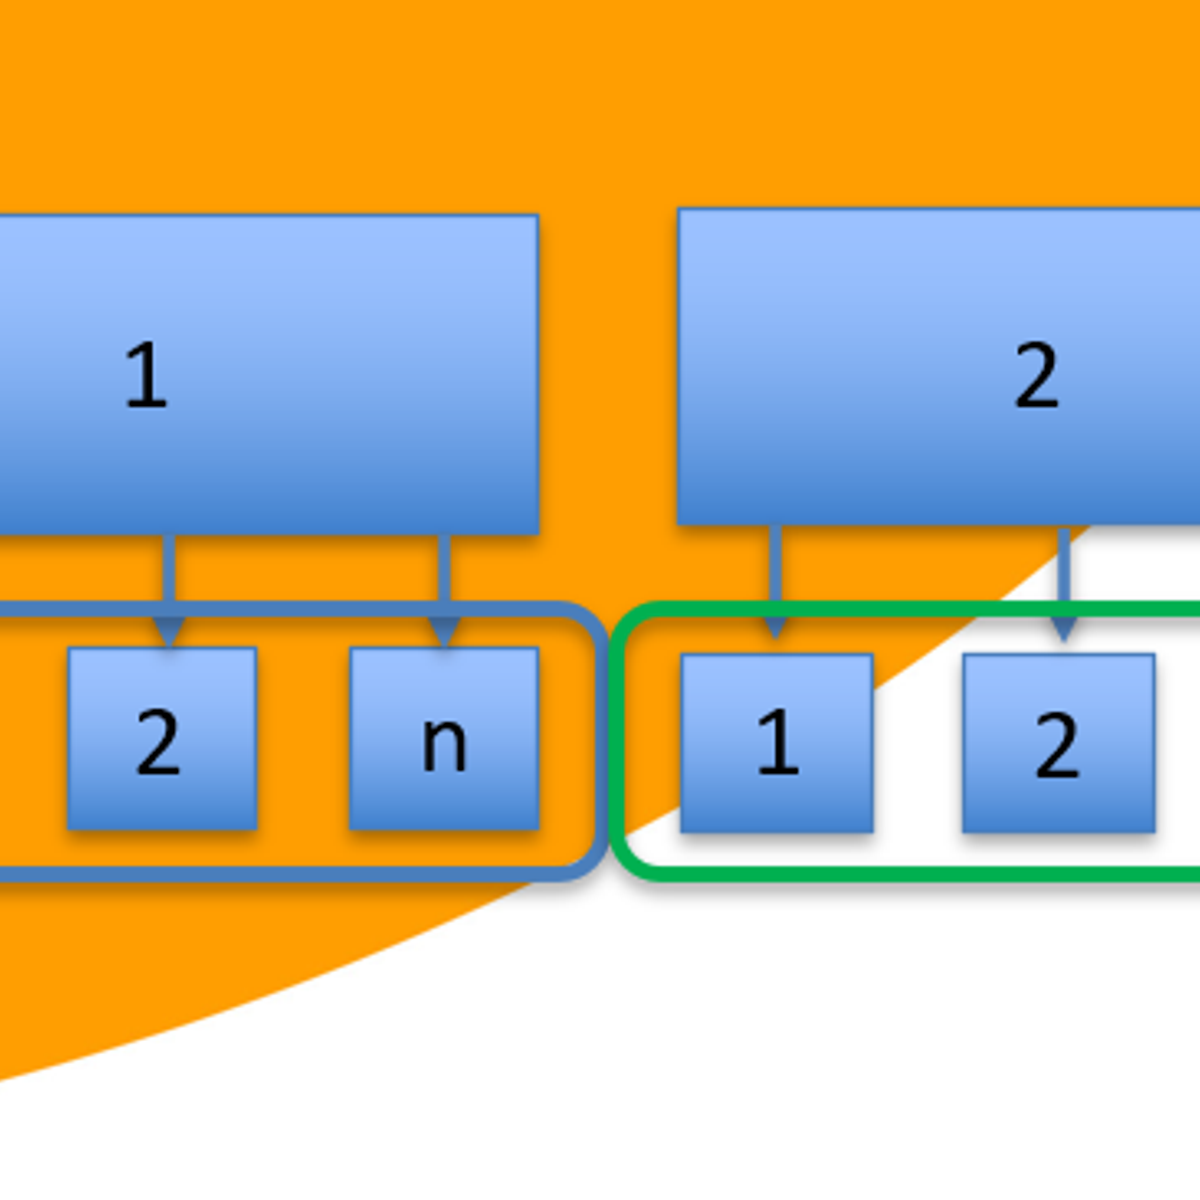
Multilevel Modeling
In this course, PhD candidates will get an introduction into the theory of multilevel modelling, focusing on two level multilevel models with a 'continuous' response variable. In addition, participants will learn how to run basic two-level model in R.
The objective of this course is to get participants acquainted with multilevel models. These models are often used for the analysis of ‘hierarchical’ data, in which observations are nested within higher level units (e.g. repeated measures nested within individuals, or pupils nested within schools). In this type of data causes of outcomes (e.g. the performance of pupils in schools) are located both at the level of the individual (e.g., own and parental resources), and at a higher, contextual, level shared by some of the individuals (e.g. characteristics of the class and of the teacher). Because of this, the assumption of 'independent observations' is violated with hierarchical data, but multilevel modelling can easily account for that. Moreover, multilevel modelling can easily deal with missing data (in most circumstances).
This course is designed and presented by Dr. Joran Jongerling on behalf of the Erasmus Graduate School of Social Sciences and the Humanities (EGSH, www.egsh.eur.nl) of the Erasmus University Rotterdam in the Netherlands. Should you have any questions about the organization or contents of the course, please send us an email at contact@egsh.eur.nl.
Quantitative Text Analysis and Scaling in R
By the end of this project, you will learn about the concept of document scaling in textual analysis in R. You will know how to load and pre-process a data set of text documents by converting the data set into a corpus and document feature matrix. You will know how to run an unsupervised document scaling model and explore and plot the scaling outcome.
Popular Internships and Jobs by Categories
Find Jobs & Internships
Browse


© 2024 BoostGrad | All rights reserved