Back to Courses


Data Management Courses - Page 29
Showing results 281-290 of 399

Use C# LINQ to process and analyze datasets
By the end of this project, you will use the Use C# LINQ to process and analyze datasets.
LINQ, Language-Integrated Query, is used in C# to perform queries on data from XML, Databases, and collections such as Lists.

Real Time Machine Learning with Cloud Dataflow and Vertex AI
This is a self-paced lab that takes place in the Google Cloud console. Implement a real-time, streaming machine learning pipeline that uses Cloud Dataflow and Vertex AI.

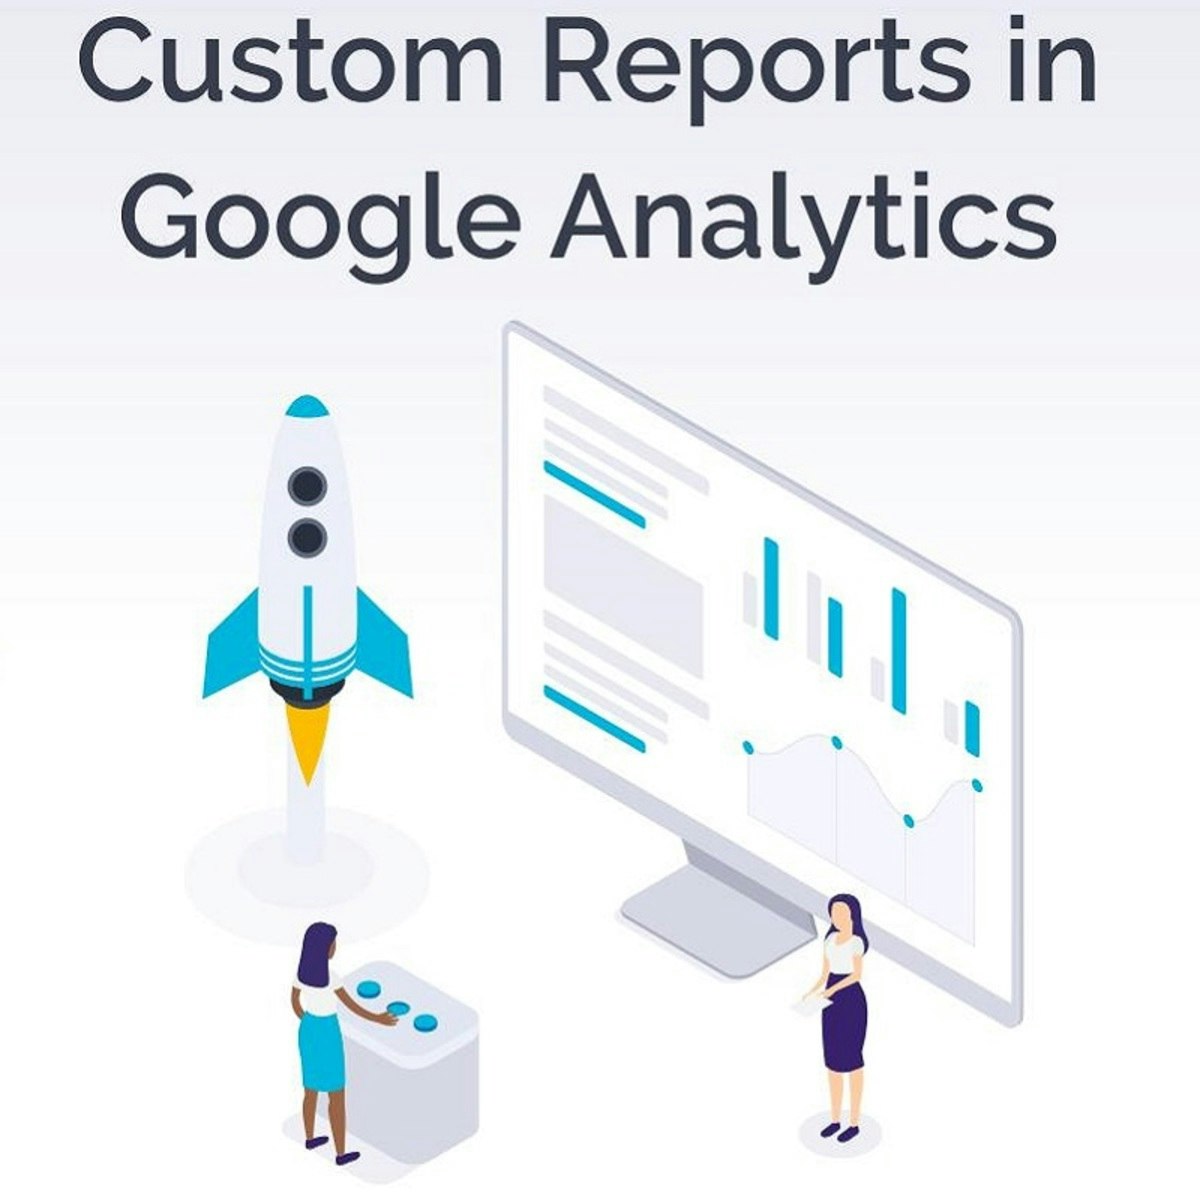
Custom Reports in Google Analytics
In this project, you will create three custom reports in Google Analytics, using three different methods. You will understand the building blocks of a custom report. You will determine what data is needed for a custom report. And, you will create the custom report to best meet your analysis and monitoring needs. You will also discover the Google Gallery where you can find various types of custom reports, and import the ones that best meet your needs.
Note: This course works best for learners who are based in the North America region. We’re currently working on providing the same experience in other regions.

Confluent: Clickstream Data Analysis Pipeline Using ksqlDB
This is a self-paced lab that takes place in the Google Cloud console. This lab will cover how to create a clickstream data analysis pipeline using ksqlDB.

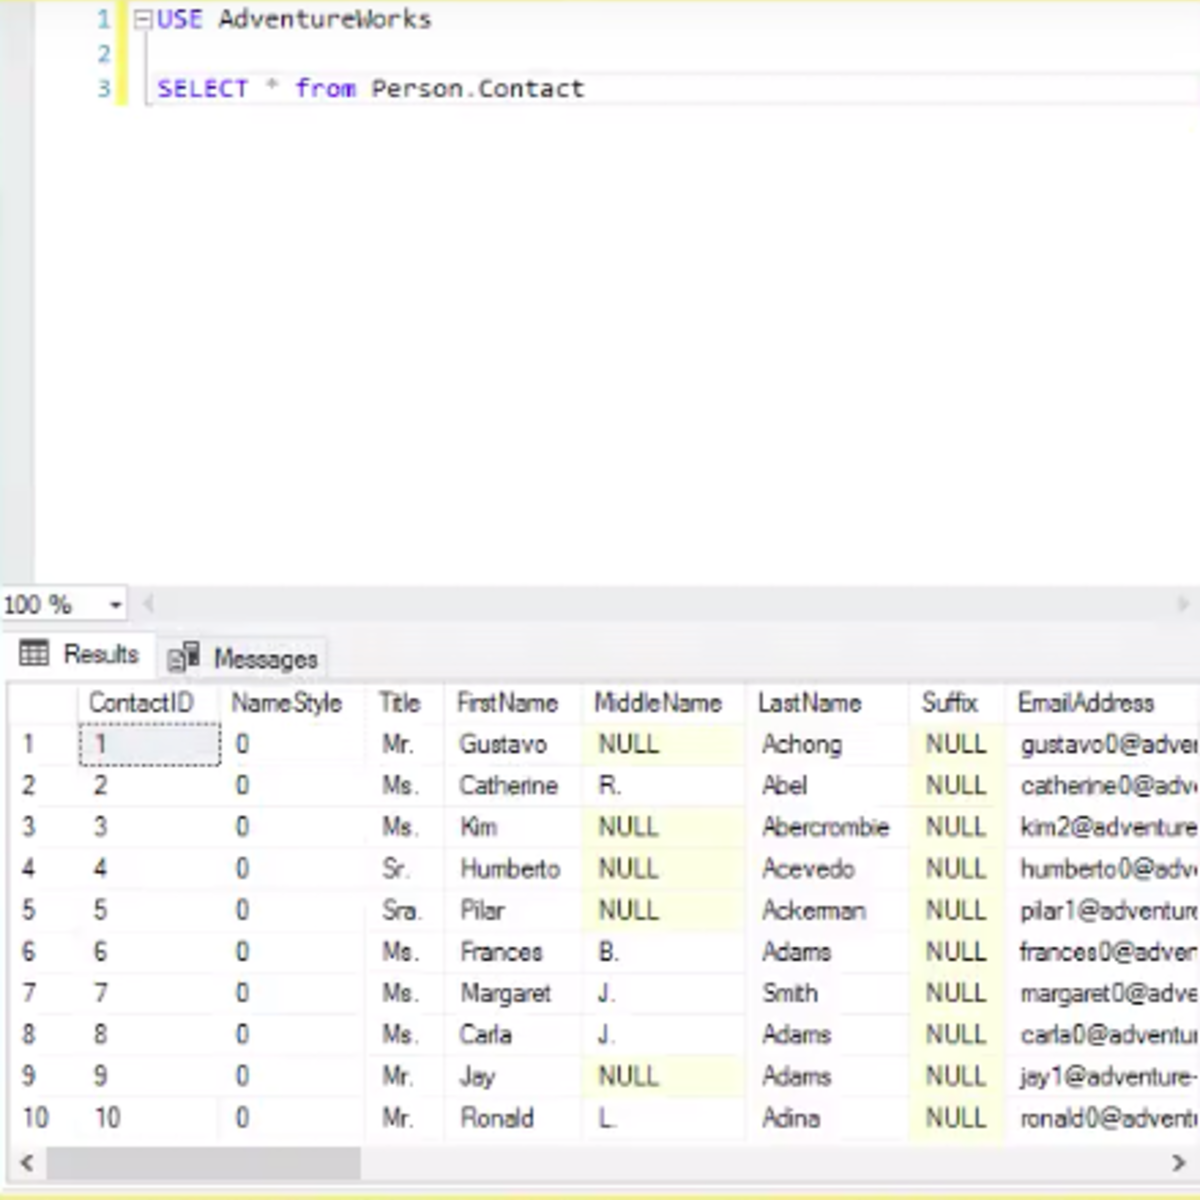
Beginning SQL Server
In this 1-hour long project-based course, you will learn how to perform core job-related tasks within the SQL Server Management Studio (SSMS) environment. You will use the tools in SSMS to automatically generate queries, manage security permissions, create dependent scripts, and create and backup a database. You will get hands-on practices performing these tasks using real data in a SQL Server Database.

Information Visualization: Programming with D3.js
In this course you will learn how to use D3.js to create powerful visualizations for web. Learning D3.js will enable you to create many different types of visualization and to visualize many different data types. It will give you the freedom to create something as simple as a bar chart as well your own new revolutionary technique.
In this course we will cover the basics of creating visualizations with D3 as well as how to deal with tabular data, geography and networks. By the end of this course you will be able to:
- Create bar and line charts
- Create choropleth and symbol maps
- Create node-link diagrams and tree maps
- Implement zooming and brushing
- Link two or more views through interaction
The course mixes theoretical and practical lectures. We will show you step by step how to use the library to build actual visualizations and what theoretical concepts lie behind them. Throughout the course you will learn skills that will lead you to building a whole application by the end of the lectures (a fully working visualization system to visualize airlines routes).
This course is the third one of the “Specialization in Information Visualization". The course expects you to have some basic knowledge of programming as well as some basic visualization skills.

Migrating MySQL User Data When Running Database Migration Service Jobs
This is a self-paced lab that takes place in the Google Cloud console.
In this lab, you learn how to migrate MySQL user data when running Database Migration Service jobs. First, you identify the existing MySQL users and update DEFINER to INVOKER for database objects on the source instance. Next, you create and save a Database Migration Service job. Then, before running the migration job, you create the necessary users on the destination database instance. Finally, you start the saved migration job; after the job runs successfully, you check the migrated data in the Cloud SQL for MySQL instance.

Evaluating a Data Model
This is a self-paced lab that takes place in the Google Cloud console. Learn the process for partitioning a data set into a training set that will be used to develop a model, and a test set that can then be used to evaluate the accuracy of the model and then independently evaluate predictive models in a repeatable manner.

Build a Google Workspace Add-on with Node.js and Cloud Run
This is a self-paced lab that takes place in the Google Cloud console. In this lab you'll learn how to build a Google Workspace Add-on using Node.js and Cloud Run.

Files and directories in the Linux filesystem
In this project, you will use Linux commands to traverse Linux directories and list files. You will also learn where certain files are stored, how to change permissions to allow access, and how to decide where files should reside.
Linux is a popular operating system that is based on the Unix operating system. It has many distributions which have different interfaces for installing software, different user interfaces, and so on. Each distribution has a similar filesystem with directories used to house and organize files.
Popular Internships and Jobs by Categories
Browse
© 2024 BoostGrad | All rights reserved


