Back to Courses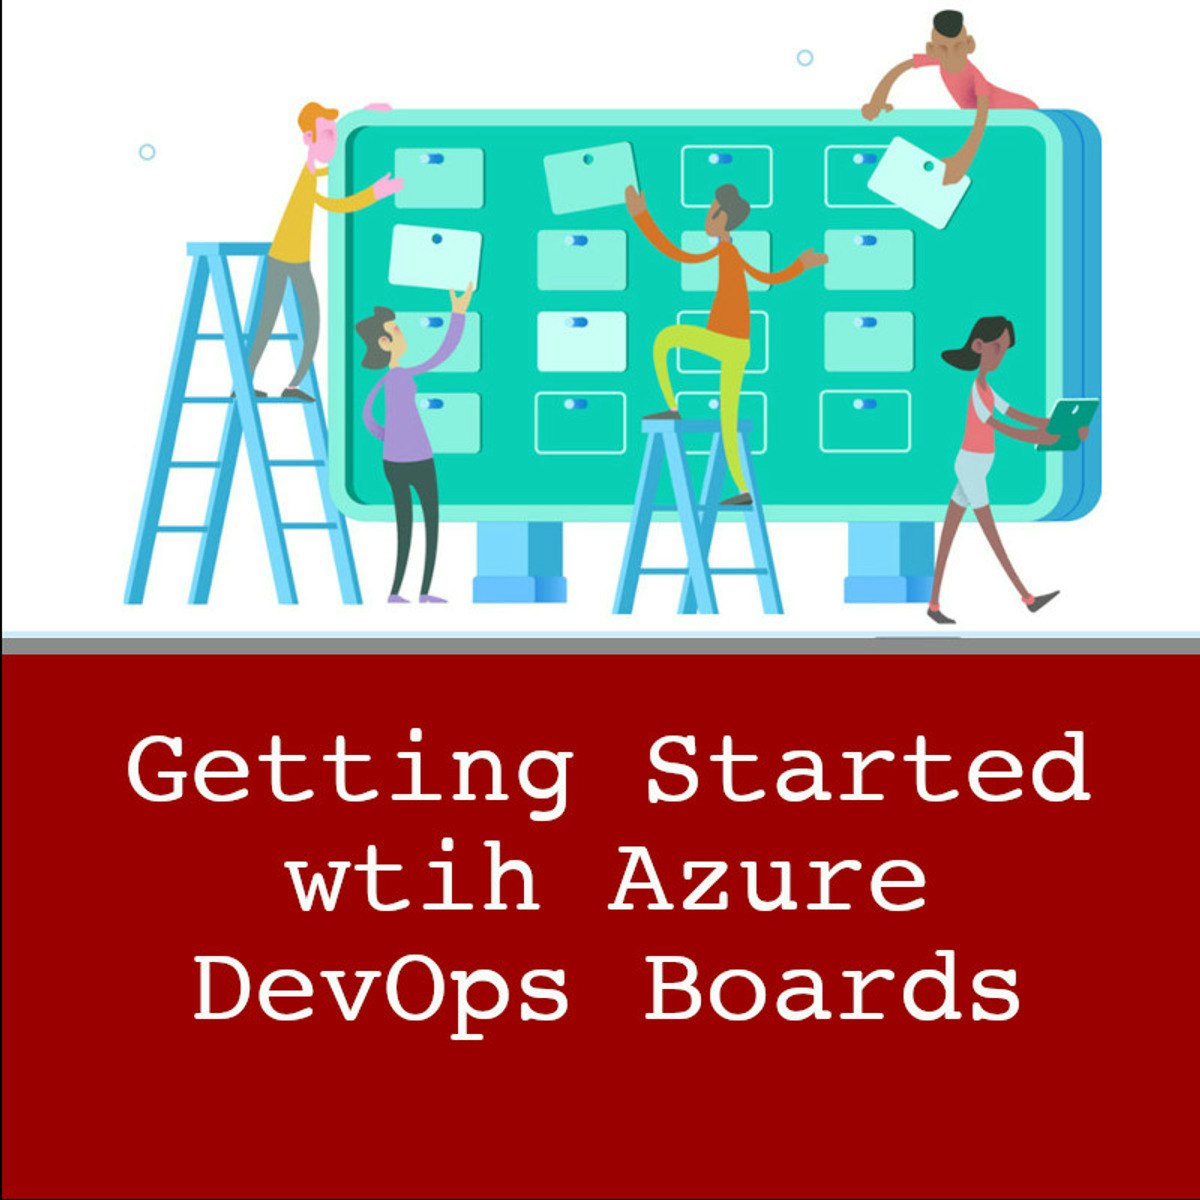


Support And Operations Courses - Page 2
Showing results 11-20 of 203
Getting Started with Azure DevOps Boards
In this guided project, you will create and setup an Azure DevOps project; add teams to your project; create, import, and manage work items; customize the project’s boards; and explore different views of your work items, and organize them into sprints.
Note: This course works best for learners who are based in the North America region. We’re currently working on providing the same experience in other regions.
Pipeline Graphs with Cloud Data Fusion
This is a self-paced lab that takes place in the Google Cloud console. This lab shows you how to use the Wrangler and Data Pipeline features in Cloud Data Fusion to clean, transform, and process taxi trip data for further analysis.
Introduction to Networking and Storage
Designed for beginners, this course is for anyone new to networking and storage. Kickstart an IT Support role or network technician role, or enhance your base knowledge for system administration.
Videos, practice activities, and virtual hands-on labs will help you develop and apply the skills you need to diagnose and repair basic networking and storage issues so you can keep users connected.
you'll learn about network types, topologies, and models, see how data travels across a network, and discover how protocols and standards enable all network activity. Then, you’ll learn how to set up and configure devices and cables for both wired and wireless networks.
And then you’ll learn to diagnose and troubleshoot network connectivity issues and discover how to use command line utilities and network tools in Windows Settings. After that, you’ll identify different types of storage drives and discover the difference between short-term and long-term memory. Lastly, you’ll find out the features of local, offsite, and cloud storage and when to use each. And you’ll investigate file, block, and object storage and work out which cloud provider solutions work best for different networking scenarios.
Reduce Costs for the Managed Service for Prometheus
This is a self-paced lab that takes place in the Google Cloud console.
In this lab, you will explore cost control mechanisms when utilizing the Managed Service for Prometheus on Google Cloud. The Google Cloud Managed Service for Prometheus charges for the number of samples ingested into Cloud Monitoring and for read requests to the Monitoring API. The number of samples ingested is the primary contributor to your cost.
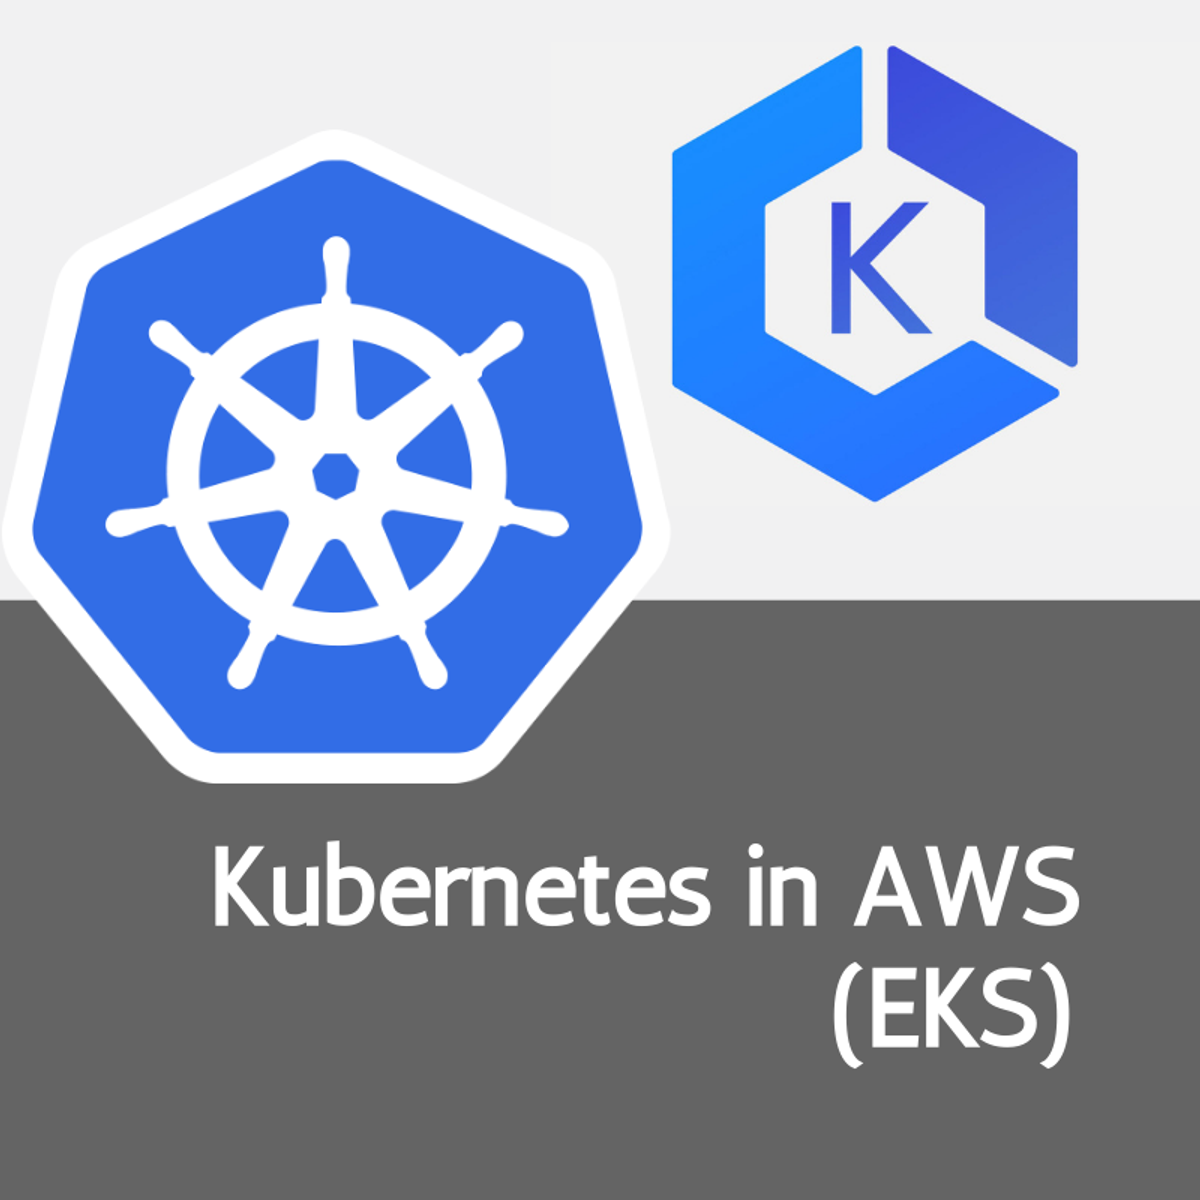
Kubernetes in AWS: Create Cluster in EKS in your own VPC
Kubernetes in AWS: Create Cluster in EKS in your own VPC
IMPORTANT: You must have or create an AWS account to work along to this course.
By the end of this course, you will know the steps necessary to set up your own EKS clusters in AWS. You will configure the AWS CLI and connect your local kubectl to the cluster so you can perform direct operations to the cluster.
Teaching with Google Classroom
This is a self-paced lab that takes place in the Google Cloud console.
As a teacher with Google Workspace for Education, use Google Classroom to set up a class; set up communication with Gmail and Google Meet through the class page; create assignments; and use Calendar to keep the class on schedule and students aware of deadlines.
Understanding and Analyzing Your Costs with Google Cloud Billing Reports
This is a self-paced lab that takes place in the Google Cloud console. In this lab, you familiarize yourself with Google Cloud Billing reports, which provides built-in cost reporting for GCP within the Google Cloud Console. You view Billing reports from a live billing account, understand current and forecasted GCP costs, and then analyze costs using report filters to identify cost drivers and trends
IS/IT Governance
Firms make significant investments in IT. In the IS/IT Governance course we will discuss how to govern IT to make sure that the IT investments contribute to organizational goals and strategies.
Firms need to formally evaluate significant IT investments. IT investments are also risky, so firms need to consider the risk associated with the investments to appropriately evaluate the investment. We will discuss how to evaluate IT investments.
Firms usually make multiple IT investments in a given year. In this course we will discuss how to evaluate a portfolio of IT investments. Firms need a mechanism to charge users for the IT investments made to encourage prudent consumption of IT resources. We will discuss different mechanisms for charging for IT that incents users to spend IT dollars wisely.
Finally, IT investments are made to generate value for the firm. This requires that employees actually use the new IT systems that is developed. Thus, in the IS/IT Governance course we will discuss strategies to make sure that users use the new system so that the firm derives value from its IT investments.
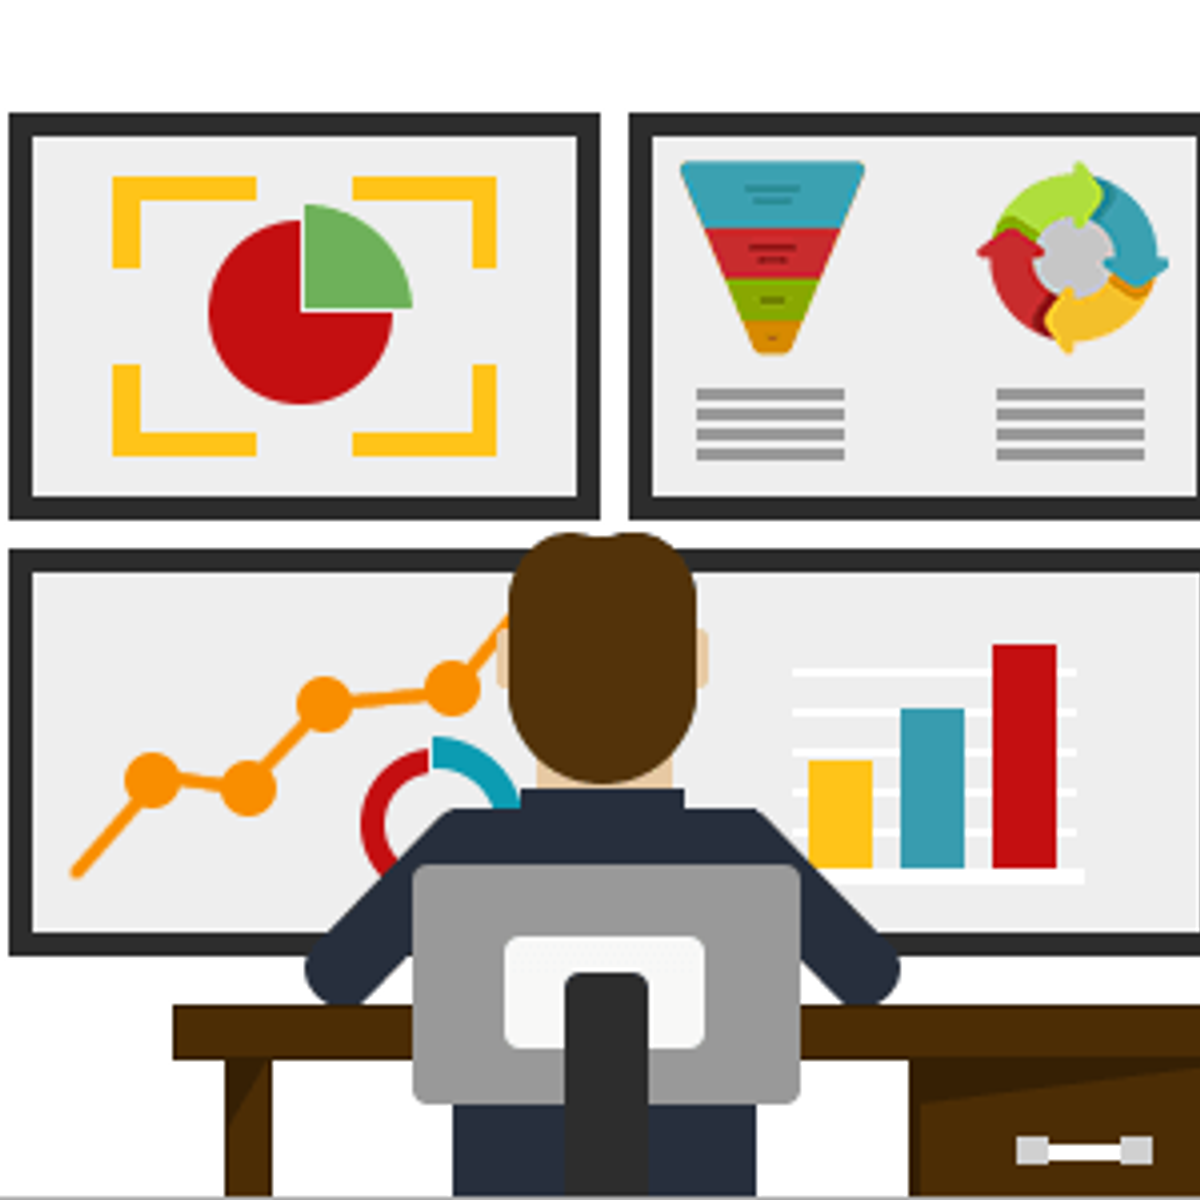
Monitoring & Telemetry for Production Systems
Monitoring & Telemetry for Production Systems is a concise guided project about various methods of monitoring Production Servers to ensure Reliability of Web Services, Sites, Servers and Applications.
This guided-project introduces you to Monitoring & Telemetry for Production Systems. The tasks comprising this project demonstrate how Production Servers and Applications are monitored and the tools used in the process.
For a successful DevOps setup, a good monitoring platform lets you monitor infrastructure and application performance, whether on-premise, in the cloud, or across containerized environments — so you have complete visibility into every system, all the time. This guided-project introduces you to these tenets of monitoring wit h meaningful hands-on exercises. By the end of this project, you will be able to:
- Learn Monitoring & Telemetry Fundamentals
- Equip yourself with Linux Command line Monitoring Tools
- Understand how to perform Server & Docker Container Monitoring with Netdata & Cadvisor
- Perform Application Monitoring & Telemetry with Prometheus & Grafana - Part I
- Perform Application Monitoring & Telemetry with Prometheus & Grafana - Part II
- Implement Log Monitoring & Analysis with ELK Stack
Ingesting HL7v2 Data with the Healthcare API
This is a self-paced lab that takes place in the Google Cloud console. In this lab you will discover and use the basic functionality of Cloud Healthcare API using HL7v2 messages.
Popular Internships and Jobs by Categories
Find Jobs & Internships
Browse


© 2024 BoostGrad | All rights reserved