Back to Courses


Data Science Courses - Page 31
Showing results 301-310 of 1407
How to Visualize Research Data in Tableau
Publishing research often requires the preparation of visual elements like charts, tables, and graphs to better explain the text in a research report. Creating these elements can be done easily and effectively in Tableau. Using Tableau, large and small data sets can be visualized with precision, creativity, interactivity, and options in Tableau. After taking this course learners will know how to create a table, a geovisualization, and a pie chart. Three of the most common research visualizations available. The learners will also learn how to upload data, how to export these tables, and how to incorporate charts and graphs in research reports.
Researchers from students to professionals will benefit from learning how to create visualizations based on surveys, observations, experiments, and other types of research methods.
Knowledge of research is useful but not required for this project.
Generate a Report with LibreOffice Base
By the end of this project you will have used LibreOffice to create a variety of reports for displaying data that originates in relational tables. A report provides a way for users to view only the data they need, and in the format that makes data analysis most effective.
Note: This course works best for learners who are based in the North America region. We’re currently working on providing the same experience in other regions.
Analyze Data in Azure ML Studio
Did you know that you can use Azure Machine Learning to help you analyze data?
In this 1-hour project-based course, you will learn how to display descriptive statistics of a dataset, measure relationships between variables and visualize relationships between variables. To achieve this, we will use one example diabetes data. We will calculate its descriptive statistics and correlations, train a machine learning model and calculate its feature importance to see how features affect the label and visualize categorical data, as well as relationships between variables, in Jupyter notebook.
In order to be successful in this project, you will need knowledge of Python language and experience with machine learning in Python. Also, Azure subscription is required (free trial is an option for those who don’t have it), as well as Azure Machine Learning resource and a compute instance within. Instructional links will be provided to guide you through creation, if needed, in the first task.
If you are ready to learn how to analyze data, this is a course for you! Let’s get started!
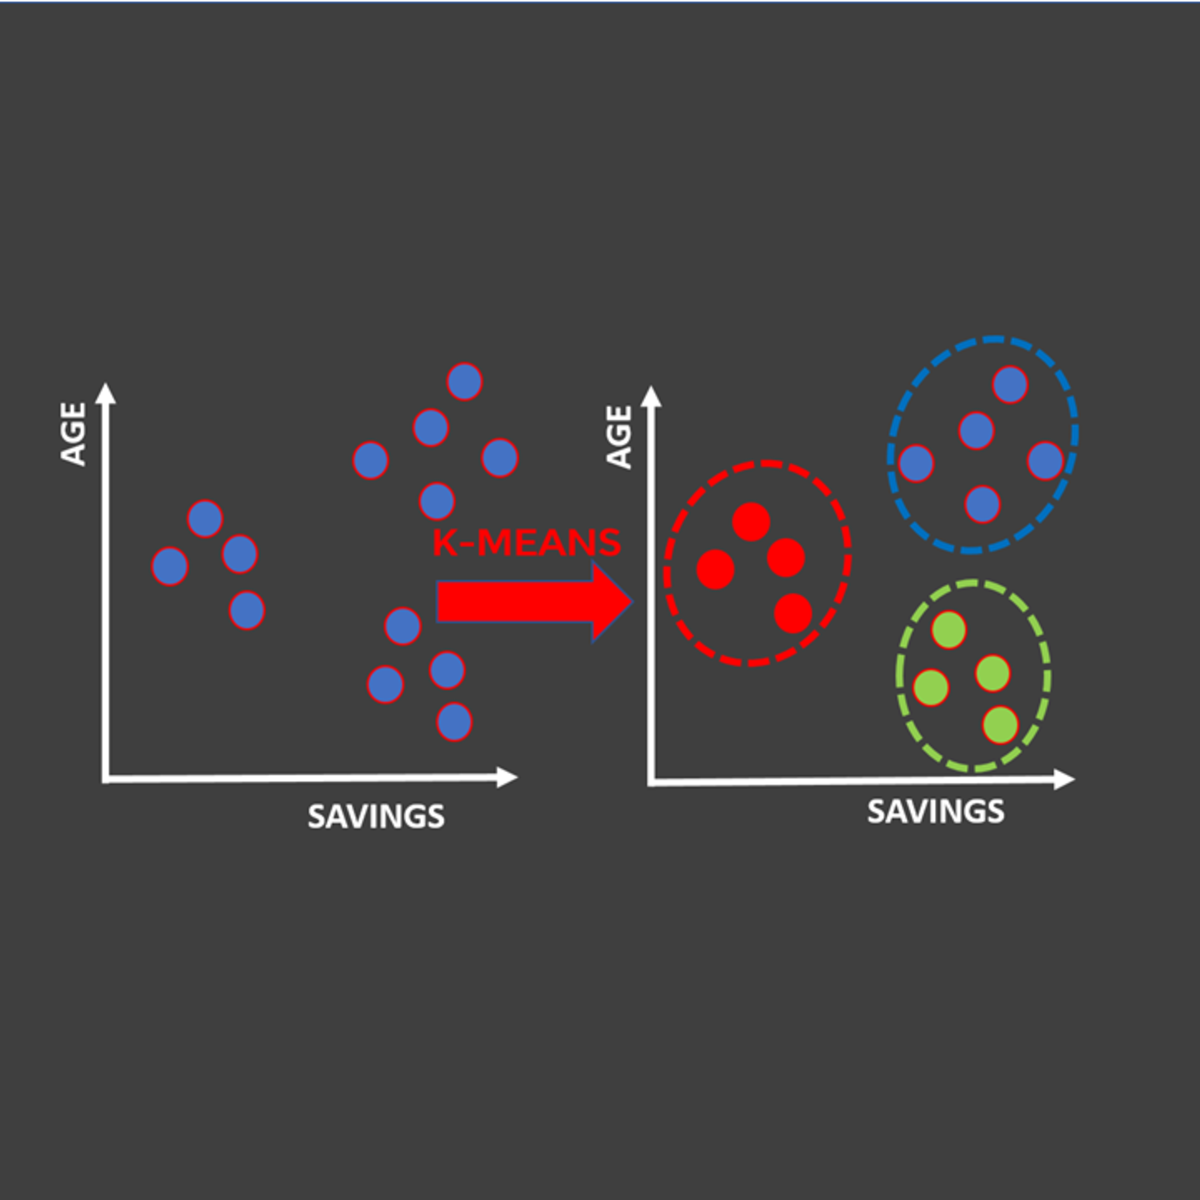
Unsupervised Machine Learning for Customer Market Segmentation
In this hands-on guided project, we will train unsupervised machine learning algorithms to perform customer market segmentation. Market segmentation is crucial for marketers since it enables them to launch targeted ad marketing campaigns that are tailored to customer's specific needs.
Note: This course works best for learners who are based in the North America region. We’re currently working on providing the same experience in other regions.
Linear Regression for Business Statistics
Regression Analysis is perhaps the single most important Business Statistics tool used in the industry. Regression is the engine behind a multitude of data analytics applications used for many forms of forecasting and prediction.
This is the fourth course in the specialization, "Business Statistics and Analysis". The course introduces you to the very important tool known as Linear Regression. You will learn to apply various procedures such as dummy variable regressions, transforming variables, and interaction effects. All these are introduced and explained using easy to understand examples in Microsoft Excel.
The focus of the course is on understanding and application, rather than detailed mathematical derivations.
Note: This course uses the ‘Data Analysis’ tool box which is standard with the Windows version of Microsoft Excel. It is also standard with the 2016 or later Mac version of Excel. However, it is not standard with earlier versions of Excel for Mac.
WEEK 1
Module 1: Regression Analysis: An Introduction
In this module you will get introduced to the Linear Regression Model. We will build a regression model and estimate it using Excel. We will use the estimated model to infer relationships between various variables and use the model to make predictions. The module also introduces the notion of errors, residuals and R-square in a regression model.
Topics covered include:
• Introducing the Linear Regression
• Building a Regression Model and estimating it using Excel
• Making inferences using the estimated model
• Using the Regression model to make predictions
• Errors, Residuals and R-square
WEEK 2
Module 2: Regression Analysis: Hypothesis Testing and Goodness of Fit
This module presents different hypothesis tests you could do using the Regression output. These tests are an important part of inference and the module introduces them using Excel based examples. The p-values are introduced along with goodness of fit measures R-square and the adjusted R-square. Towards the end of module we introduce the ‘Dummy variable regression’ which is used to incorporate categorical variables in a regression.
Topics covered include:
• Hypothesis testing in a Linear Regression
• ‘Goodness of Fit’ measures (R-square, adjusted R-square)
• Dummy variable Regression (using Categorical variables in a Regression)
WEEK 3
Module 3: Regression Analysis: Dummy Variables, Multicollinearity
This module continues with the application of Dummy variable Regression. You get to understand the interpretation of Regression output in the presence of categorical variables. Examples are worked out to re-inforce various concepts introduced. The module also explains what is Multicollinearity and how to deal with it.
Topics covered include:
• Dummy variable Regression (using Categorical variables in a Regression)
• Interpretation of coefficients and p-values in the presence of Dummy variables
• Multicollinearity in Regression Models
WEEK 4
Module 4: Regression Analysis: Various Extensions
The module extends your understanding of the Linear Regression, introducing techniques such as mean-centering of variables and building confidence bounds for predictions using the Regression model. A powerful regression extension known as ‘Interaction variables’ is introduced and explained using examples. We also study the transformation of variables in a regression and in that context introduce the log-log and the semi-log regression models.
Topics covered include:
• Mean centering of variables in a Regression model
• Building confidence bounds for predictions using a Regression model
• Interaction effects in a Regression
• Transformation of variables
• The log-log and semi-log regression models
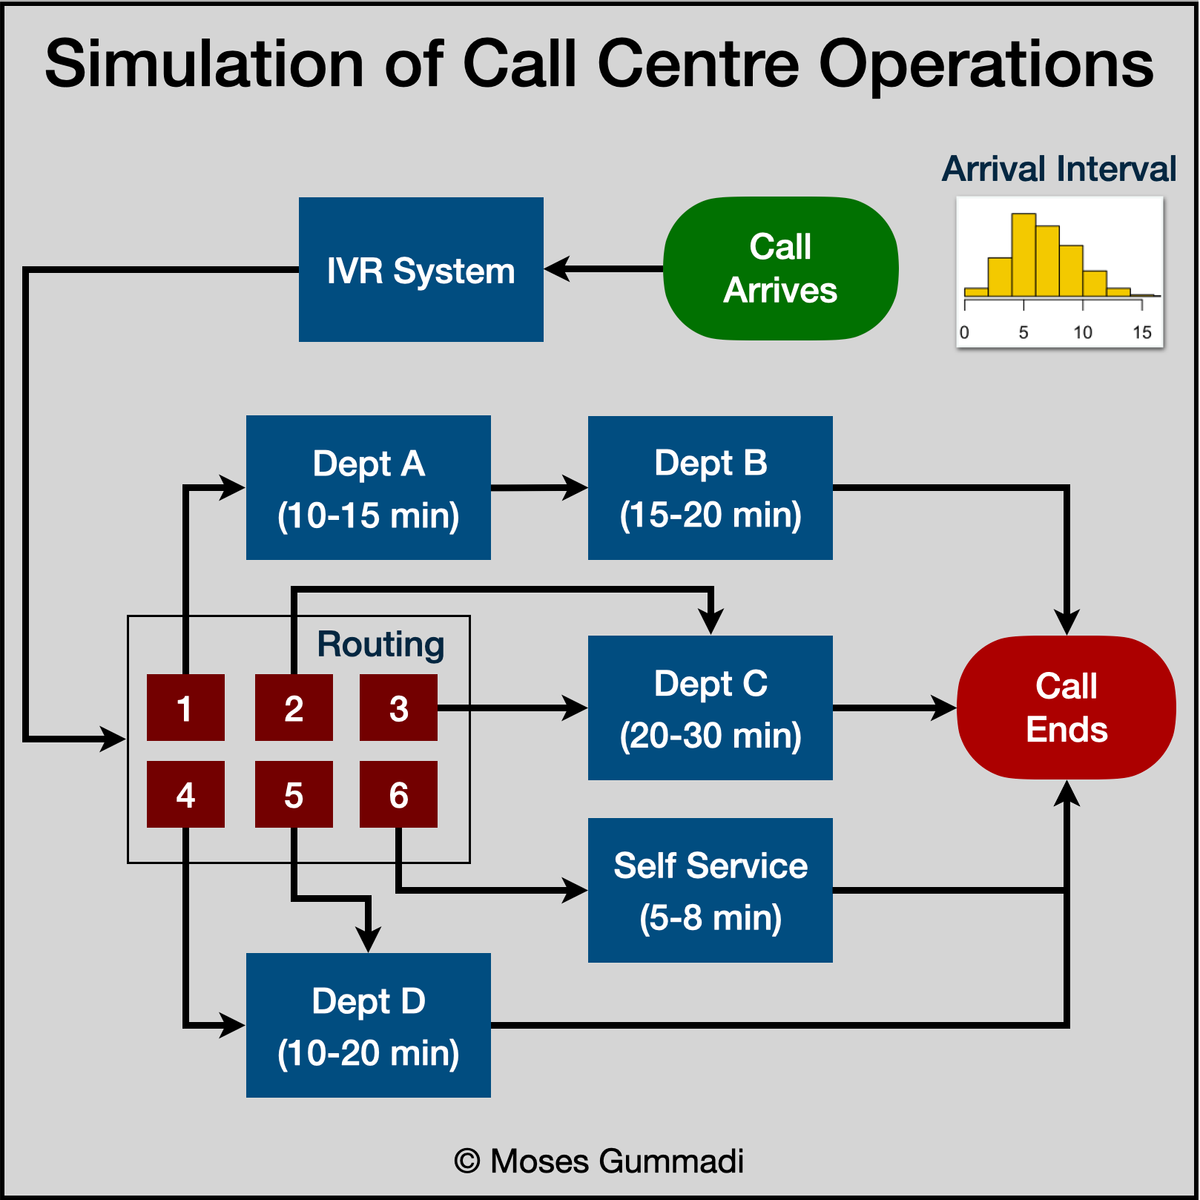
Simulation of Call Centre Operations Using R Simmer
Introduction To Call Centre Simulation Process
Create Statistical Variables Required For Simulation
Define Trajectories for Call Centre Departments
Define Teams, Resources & Arrivals of Calls
Run Call Centre Simulation & Store Results
Plot Charts & Interpret Simulation Results
Designing data-intensive applications
Welcome to the specialization course of Designing data-intensive applications.
This course will be completed on four weeks, it will be supported with videos and exercises.
By the end of this specialization, learners will be able to propose, design, justify and develop high reliable information systems according to type of data and volume of information, response time, type of processing and queries in order to support scalability, maintainability, security and reliability considering the last information technologies.
Software to download:
MySQL Workbench
Rapidminer
Hadoop framework Hortonworks
MongoDB
In case you have a Mac / IOS operating system you need to perform an action called VirtualBox.
Getting Started with Data Visualization in R
Data visualization is a critical skill for anyone that routinely using quantitative data in his or her work - which is to say that data visualization is a tool that almost every worker needs today. One of the critical tools for data visualization today is the R statistical programming language. Especially in conjunction with the tidyverse software packages, R has become an extremely powerful and flexible platform for making figures, tables, and reproducible reports. However, R can be intimidating for first time users, and there are so many resources online that it can be difficult to sort through without guidance.
To fill that need, this course is intended for learners who have little or no experience with R but who are looking for an introduction to this tool. By the end of this course, students will be able to import data into R, manipulate that data using tools from the popular tidyverse package, and make simple reports using R Markdown. The course is designed for students with good basic computing skills, but limited if any experience with programming.
Developing Data Products
A data product is the production output from a statistical analysis. Data products automate complex analysis tasks or use technology to expand the utility of a data informed model, algorithm or inference. This course covers the basics of creating data products using Shiny, R packages, and interactive graphics. The course will focus on the statistical fundamentals of creating a data product that can be used to tell a story about data to a mass audience.
Predicting Salaries with Decision Trees
In this 1.5 hour long project-based course, you will tackle a real-world prediction problem using machine learning. The dataset we are going to use comes from the U.S. Census Bureau; they recorded a number of attributes such as gender and occupation as well as the salary range for a sample of more than 32,000 Americans. We will fit a decision tree to this data, and try to predict the salary for a person we haven’t seen before.
By the end of this project, you will have created a machine learning model using industry standard tools, including Python and sklearn.
Note: This course works best for learners who are based in the North America region. We’re currently working on providing the same experience in other regions.
Popular Internships and Jobs by Categories
Find Jobs & Internships
Browse


© 2024 BoostGrad | All rights reserved