
Back to Courses


Data Science Courses - Page 125
Showing results 1241-1250 of 1407
Cloud Computing Basics (Cloud 101)
Welcome to Cloud Computing Basics (Cloud 101).
Over the next few weeks, we will discuss the basics of Cloud computing: what it is, what it supports, and how it is delivered. We will delve into storage services, Cloud economics, levels of managed infrastructure, and Azure services. We will also explore different deployment models of Cloud computing, as well as several hosting scenarios. Last but not least, we will compare some of the cloud platforms and discuss the future of cloud computing.
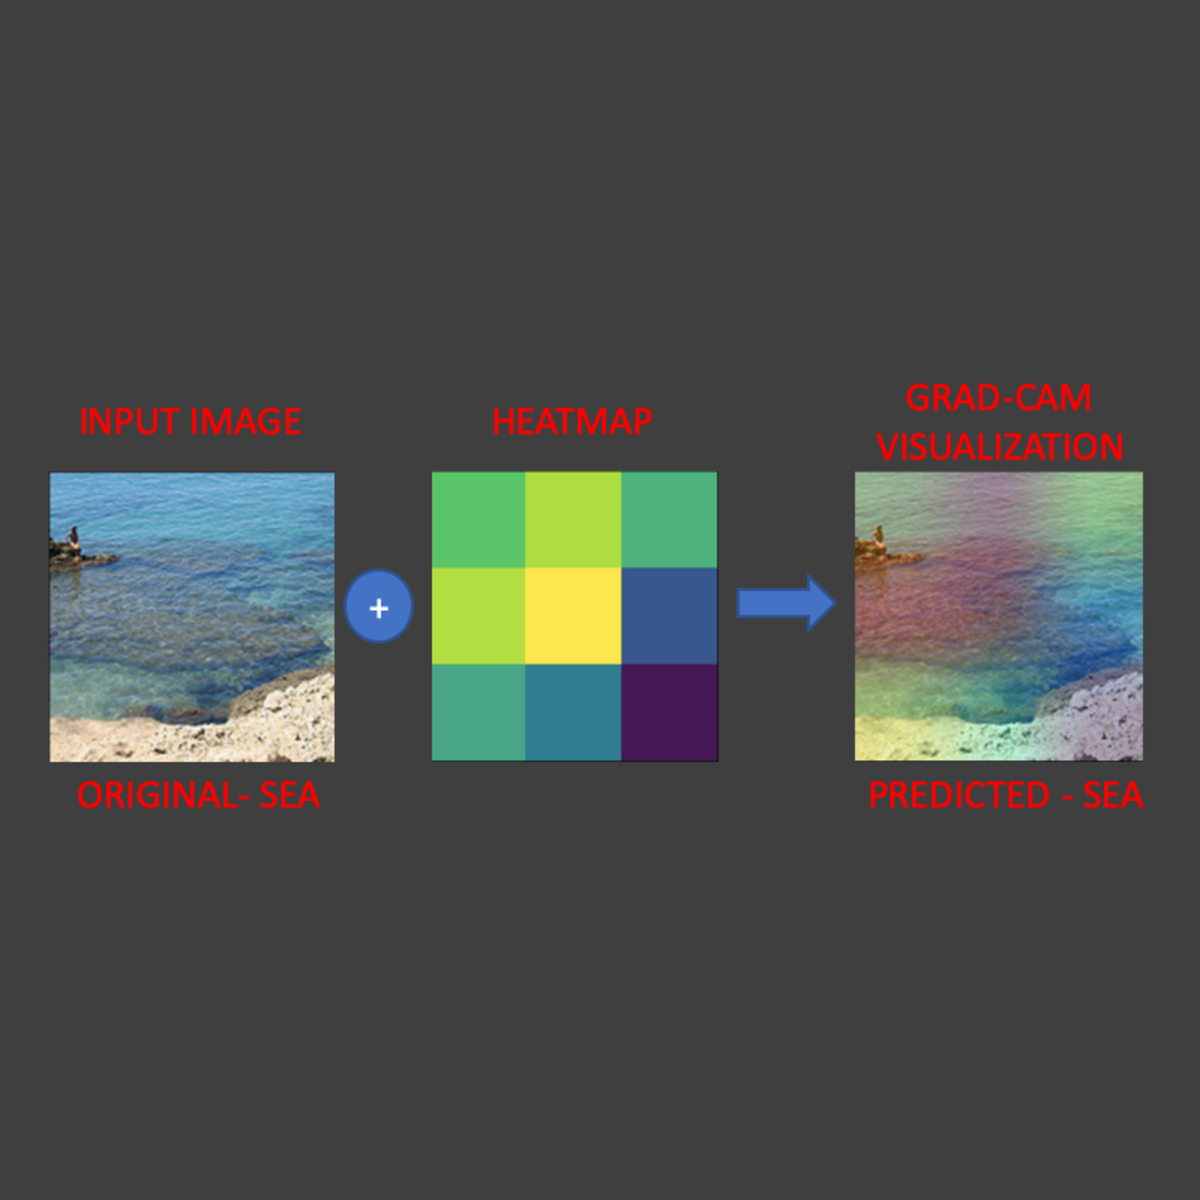
Explainable AI: Scene Classification and GradCam Visualization
In this 2 hour long hands-on project, we will train a deep learning model to predict the type of scenery in images. In addition, we are going to use a technique known as Grad-Cam to help explain how AI models think. This project could be practically used for detecting the type of scenery from the satellite images.
A Scientific Approach to Innovation Management
How can innovators understand if their idea is worth developing and pursuing? In this course, we lay out a systematic process to make strategic decisions about innovative product or services that will help entrepreneurs, managers and innovators to avoid common pitfalls. We teach students to assess the feasibility of an innovative idea through problem-framing techniques and rigorous data analysis labelled ‘a scientific approach’. The course is highly interactive and includes exercises and real-world applications. We will also show the implications of a scientific approach to innovation management through a wide range of examples and case studies.
Interpretable machine learning applications: Part 3
In this 50 minutes long project-based course, you will learn how to apply a specific explanation technique and algorithm for predictions (classifications) being made by inherently complex machine learning models such as artificial neural networks. The explanation technique and algorithm is based on the retrieval of similar cases with those individuals for which we wish to provide explanations. Since this explanation technique is model agnostic and treats the predictions model as a 'black-box', the guided project can be useful for decision makers within business environments, e.g., loan officers at a bank, and public organizations interested in using trusted machine learning applications for automating, or informing, decision making processes.
The main learning objectives are as follows:
Learning objective 1: You will be able to define, train and evaluate an artificial neural network (Sequential model) based classifier by using keras as API for TensorFlow. The pediction model will be trained and tested with the HELOC dataset for approved and rejected mortgage applications.
Learning objective 2: You will be able to generate explanations based on similar profiles for a mortgage applicant predicted either as of "Good" or "Bad" risk performance.
Learning objective 3: you will be able to generate contrastive explanations based on feature and pertinent negative values, i.e., what an applicant should change in order to turn a "rejected" application to an "approved" one.
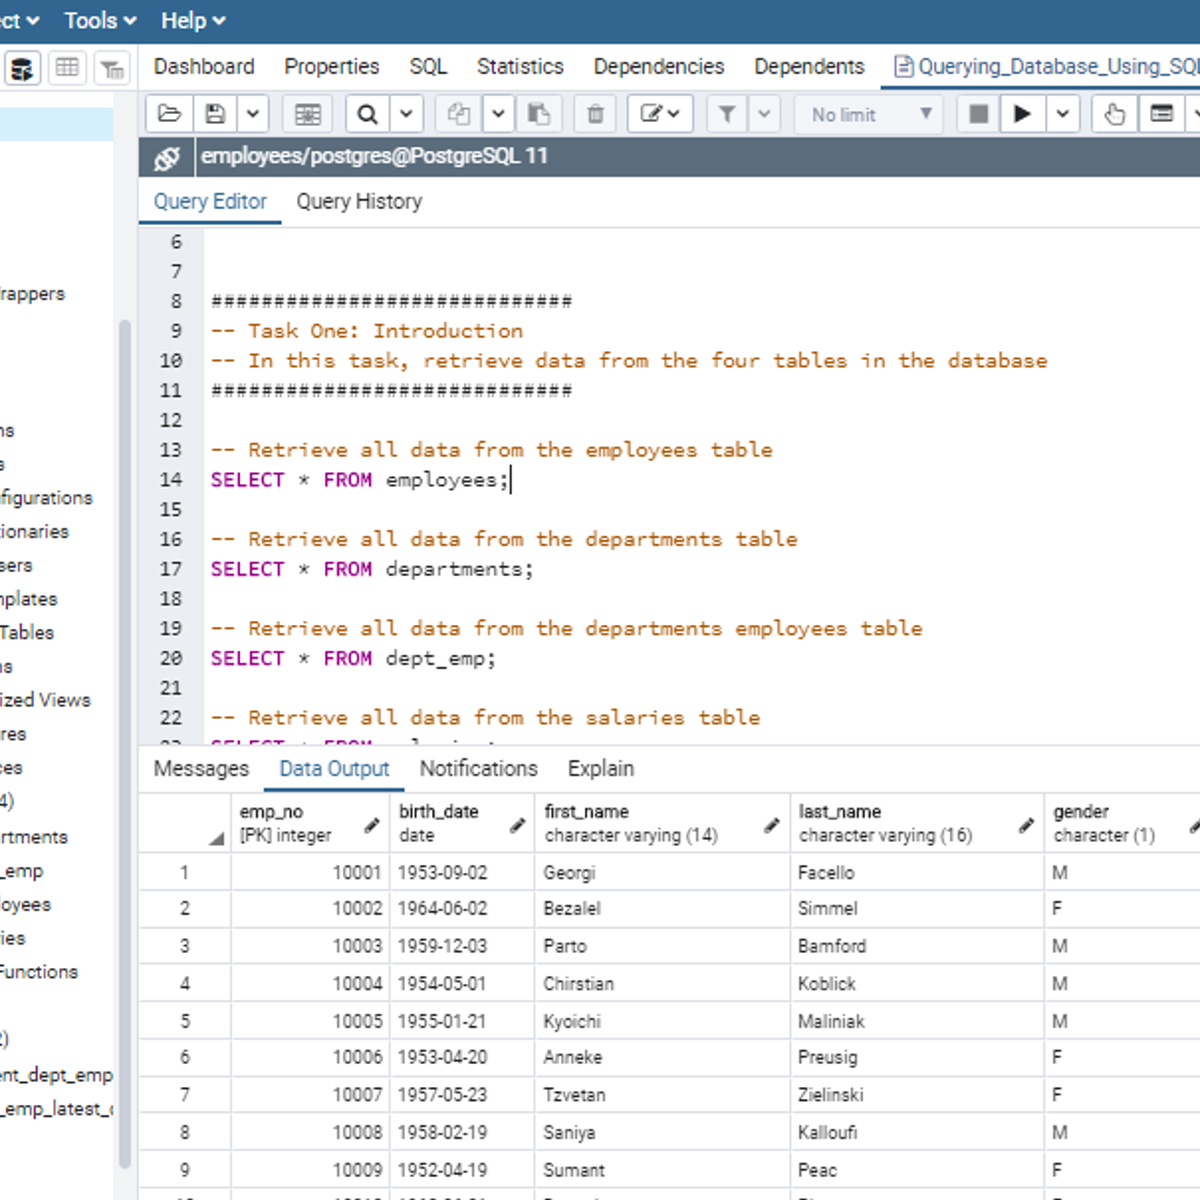
Querying Databases Using SQL SELECT statement
In this 2-hour long project-based course, you will learn how to retrieve data from tables in a database using SQL SELECT statement. In addition, this project will expose you to how to use different SQL operators together with the WHERE clause to set conditions on tables in a database for database manipulation. In order to reinforce the use of SQL SELECT statement to query a database for database insights, you will work on different tasks as the concepts are being introduced to you.
Note: You do not need to be a data administrator or data analyst to be successful in this guided project, just a familiarity with SQL is required. If you are not familiar with SQL and want to learn the basics, start with my previous guided project titled “Performing Data Definition and Manipulation in SQL”.
Getting Started with CyberGIS
This course is intended to introduce students to CyberGIS—Geospatial Information Science and Systems (GIS)—based on advanced cyberinfrastructure as well as the state of the art in high-performance computing, big data, and cloud computing in the context of geospatial data science. Emphasis is placed on learning the cutting-edge advances of cyberGIS and its underlying geospatial data science principles.
Wearable Technologies and Sports Analytics
Sports analytics now include massive datasets from athletes and teams that quantify both training and competition efforts. Wearable technology devices are being worn by athletes everyday and provide considerable opportunities for an in-depth look at the stress and recovery of athletes across entire seasons. The capturing of these large datasets has led to new hypotheses and strategies regarding injury prevention as well as detailed feedback for athletes to try and optimize training and recovery.
This course is an introduction to wearable technology devices and their use in training and competition as part of the larger field of sport sciences. It includes an introduction to the physiological principles that are relevant to exercise training and sport performance and how wearable devices can be used to help characterize both training and performance. It includes access to some large sport team datasets and uses programming in python to explore concepts related to training, recovery and performance.
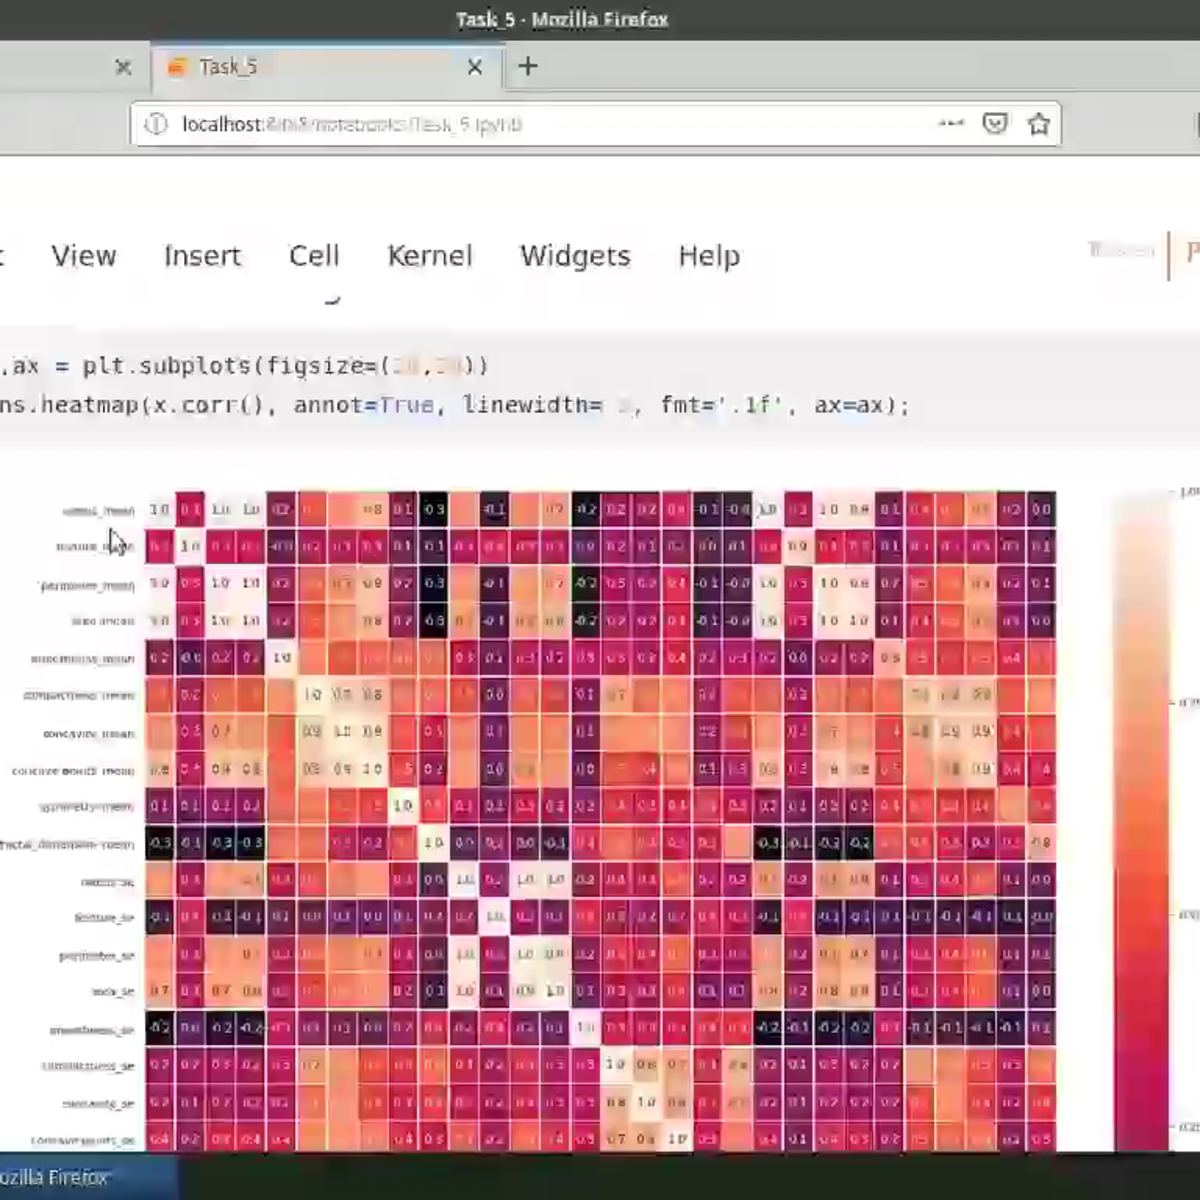
Exploratory Data Analysis with Seaborn
Producing visualizations is an important first step in exploring and analyzing real-world data sets. As such, visualization is an indispensable method in any data scientist's toolbox. It is also a powerful tool to identify problems in analyses and for illustrating results.In this project-based course, we will employ the statistical data visualization library, Seaborn, to discover and explore the relationships in the Breast Cancer Wisconsin (Diagnostic) Data Set. We will cover key concepts in exploratory data analysis (EDA) using visualizations to identify and interpret inherent relationships in the data set, produce various chart types including histograms, violin plots, box plots, joint plots, pair grids, and heatmaps, customize plot aesthetics and apply faceting methods to visualize higher dimensional data.
This course runs on Coursera's hands-on project platform called Rhyme. On Rhyme, you do projects in a hands-on manner in your browser. You will get instant access to pre-configured cloud desktops containing all of the software and data you need for the project. Everything is already set up directly in your internet browser so you can just focus on learning. For this project, you’ll get instant access to a cloud desktop with Python, Jupyter, and scikit-learn pre-installed.
Notes:
- You will be able to access the cloud desktop 5 times. However, you will be able to access instructions videos as many times as you want.
- This course works best for learners who are based in the North America region. We’re currently working on providing the same experience in other regions.
Neural Networks and Random Forests
In this course, we will build on our knowledge of basic models and explore advanced AI techniques. We’ll start with a deep dive into neural networks, building our knowledge from the ground up by examining the structure and properties. Then we’ll code some simple neural network models and learn to avoid overfitting, regularization, and other hyper-parameter tricks. After a project predicting likelihood of heart disease given health characteristics, we’ll move to random forests. We’ll describe the differences between the two techniques and explore their differing origins in detail. Finally, we’ll complete a project predicting similarity between health patients using random forests.
Data Literacy Capstone – Evaluating Research
This is the final course in the Data Literacy Specialization. In this capstone course, you'll apply the skills and knowledge you have acquired in the specialization to the critical evaluation of an original quantitative analysis. The project will first require you to identify and read a piece of high-quality, original, quantitative research on a topic of your choosing. You’ll then interpret and evaluate the findings as well as the methodological approach. As part of the project, you’ll also review other students’ submissions. By the end of the project, you should be empowered to be a critical consumer and user of quantitative research.